Where to Hide if the Gov't Bond Selloff Continues
Author: Chris Wood
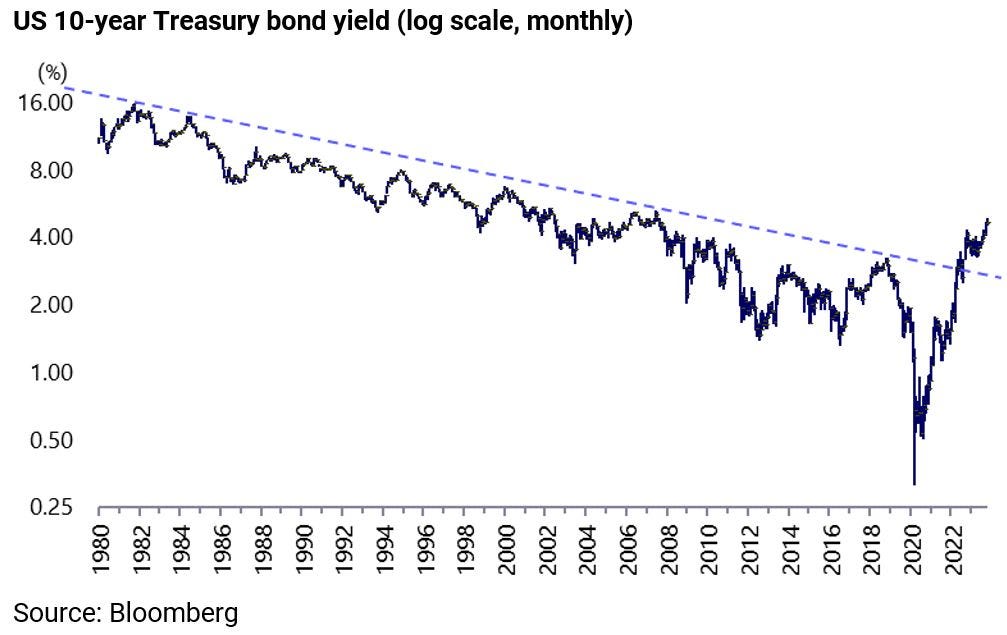
This writer remains a structural bear on US Treasury bonds and indeed also on G7 government bonds.
Yet a tactical rally in Treasuries had been expected last quarter, with the resumption of quanto tightening in the context of the still anticipated downturn in the US economy as a result of the considerable lags in monetary tightening discussed here previously (see When will the recession start? The answer may surprise you, 3 May 2023).
This raises the issue of why Treasury bonds corrected over the summer in the absence of unusually strong data.
Possible explanations for bond weakness include the oil price factor and Japanese selling triggered by the Bank of Japan’s adjustment of yield curve control in late July.
But another is a reaction to the surprisingly timed Fitch downgrade of US sovereign debt.
Fitch Ratings downgraded the US long-term credit rating from Triple-A to AA+ on 1 August.
This writer says “surprisingly timed” in the sense that there was no obvious catalyst for the move unless it was the growing number of indictments against America’s 45th president.
On this point, it should be noted that one of the factors Fitch highlighted was “political standoffs”.
More precisely, Fitch said in the statement: “The repeated debt-limit political standoffs and last-minute resolutions have eroded confidence in fiscal management.”
Fitch also noted that US general government debt, including state and local government debt, at an estimated 112.9% of GDP this year, is more than 2.5x higher than the 39.3% of GDP median for AAA-rated sovereigns and 44.7% of GDP for AA-rated sovereigns.
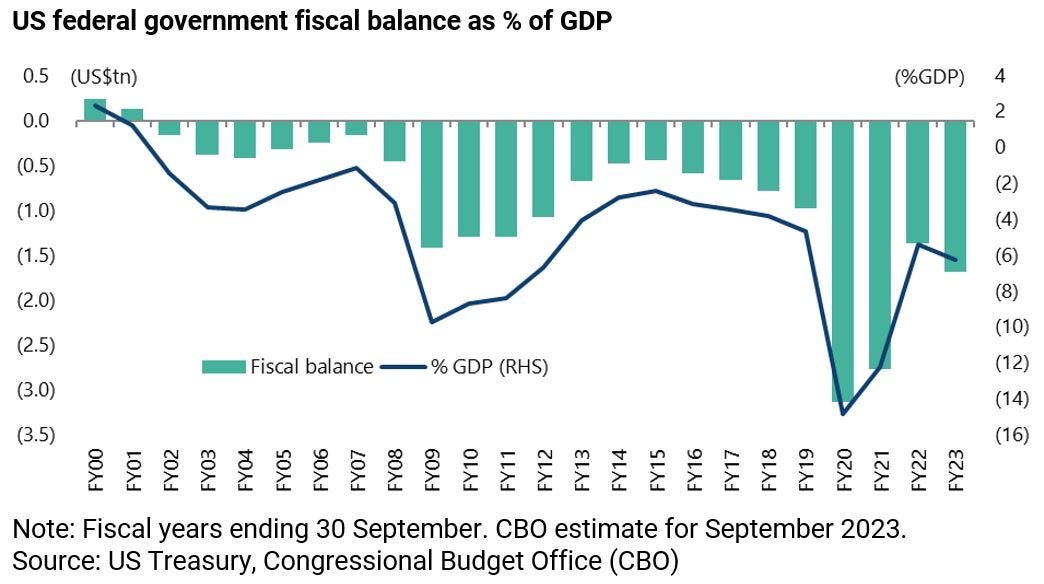
Still if the timing was a surprise, the reality is that there is never a good time to downgrade from a Washington perspective while America’s fiscal situation has been deteriorating dramatically ever since the MMT-lite policy response triggered by Covid in early 2022.
This deterioration has been primarily driven by the rise in the cost of debt servicing, which is the consequence of the growing evidence, as suggested by the technicals, that Treasury bonds are in a bear market.
One way of measuring that deterioration is the rising percentage of tax revenues being spent on interest payments.
Annualised net interest payments as a percentage of federal government revenues have risen from 8.3% in April 2022 to an estimated 14.2% in August, the highest level since August 1998.
It is also the case that the federal government deficit rose by 23% YoY to US$1.69tn in the past fiscal year (October 2022 – September 2023), up from US$1.375tn in FY22, based on the Congressional Budget Office’s (CBO) estimate for September.
This compares with the CBO’s most recent projection published in May of a full-year deficit of US$1.5tn for fiscal 2023 ending 30 September.
Rising US Deficits are Spooking Foreign Governments Away from Treasuries
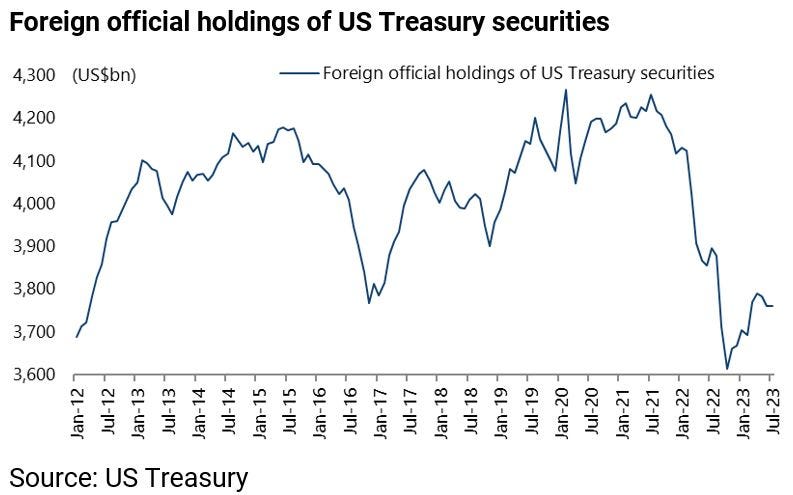
The fiscal deterioration, now formally confirmed by Fitch, is why foreign official holdings of Treasury bonds continue to decline, and not just the holdings of the two biggest lenders China and Japan.
Foreign official holdings of US Treasuries have declined by 12% from US$4.25tn in July 2021 to US$3.76tn in July 2023, the latest data available, though up from a recent low of US$3.61tn in October 2022.
Meanwhile, China’s holdings of US Treasuries have declined by 26% from US$1.1tn in February 2021 to US$822bn in July, while Japan’s holdings are down 16% from US$1.33tn in November 2021 to US$1.11tn in July.
This is also a related reason for the decline in the US dollar’s share of foreign exchange reserves.
The IMF’s Currency Composition of Official Foreign Exchange Reserves (COFER) data shows that the US dollar’s share of global foreign exchange reserves declined to 58.5% at the end of 2022, the lowest level since the data began in 1995, though it rose to 58.9% at the end of 2Q23, the latest data available.
This compared with a recent high of 66% reached in 1Q15 and a record high of 72.7% in 2Q01.
The Dollar has Likely Peaked
The logical conclusion of the above growing evidence of foreigners’ increasing reluctance to finance America’s federal government borrowing is that the dollar may have put in another long-term peak at the recent high reached in late September 2022 even though that was 31% below the all-time high reached back in February 1985 based on the US dollar index (DXY).
The index has so far declined by 7% from the peak last September.
A Weakening Dollar is Good for Commodities and Emerging Markets
If that is the base case on the US dollar, until proven wrong, this also has positive implications for both the commodity and emerging market asset classes.
The key feature of emerging markets for now remains the dramatic divergence in recent years between the outperformance of local currency emerging market government bonds relative to G7 government bonds in stark contrast to the continuing underperformance of emerging market equities relative to global equities.
The chart below highlights the above divergent trends.
The MSCI Emerging Markets relative to the MSCI AC World is now just 1.4% above the 20-year relative low reached recently on 10 October.
By contrast, the Bloomberg Emerging Markets local currency government bond index has outperformed the Bloomberg Global sovereign bond index by 29% since March 2020.
The bull case for emerging market equities is clearly that they play catch up on the outperformance of emerging market debt as a result of the more orthodox monetary and fiscal policies pursued in the emerging markets in recent years relative to G7, and the resulting lower cost of capital.
But for this to happen the Fed has to start cutting rates at some point in the context of a declining dollar.
If this is the bull case, one obvious complicating factor for emerging market equities is the structural challenges facing China, in terms of the lack of perceived growth drivers.
That is why there is now growing interest in emerging market ex-China mandates among global investors.


