US Colleges Have a $1 Trillion Illiquid Asset Problem

Author: Chris Wood
“Liberation Impoverishment day” on 2 April more than lived up to this writer’s expectations with US$7.4trn wiped off the US stock market and US$12.8trn off world stock market capitalisation since the 2 April announcement on tariffs as of the close on 8 April.
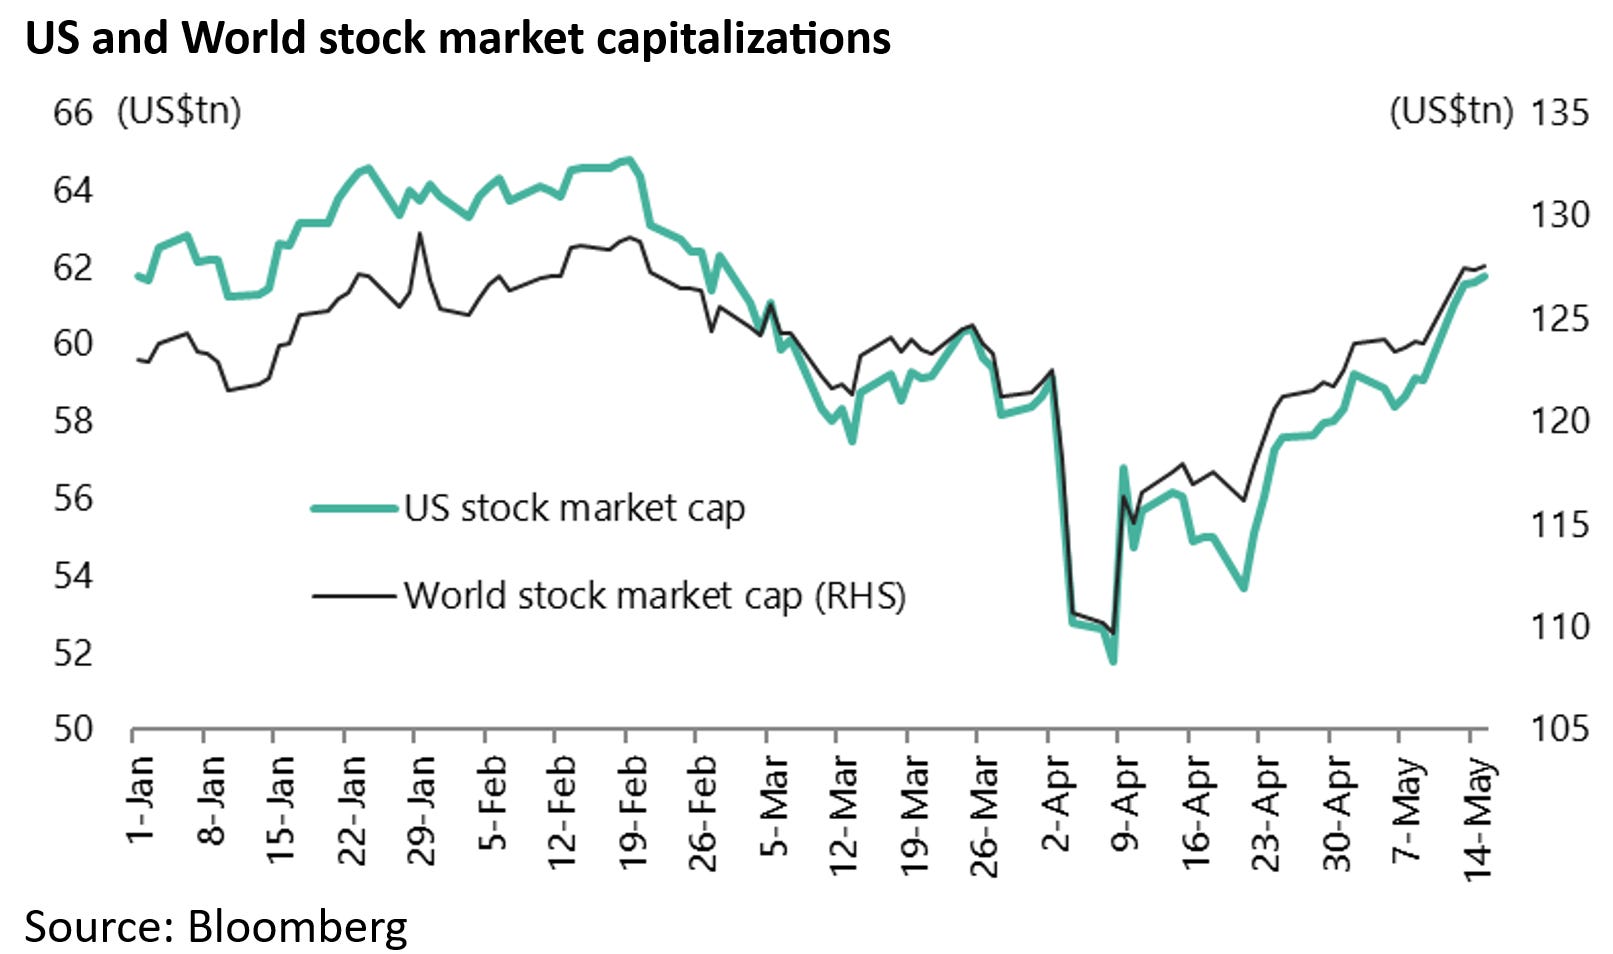
That market action is prior to the dramatic rebound triggered by Donald Trump’s continuing U-turn on his tariff agenda.
Markets have been celebrating since Trump did the first U-turn on his tariff agenda one week after “Liberation Day” when he announced on 9 April a 90-day pause on the so-called “reciprocal” tariffs, with the exception of China.
The S&P500 has risen by 23% since bottoming on 7 April (intraday low) and is up 20% from the closing low on 8 April, the day before the U-turn.

This is in the context of the Trump administration announcing on 12 May a sharp reduction in the reciprocal tariffs on China from 145% to 30% for 90 days beginning 14 May.
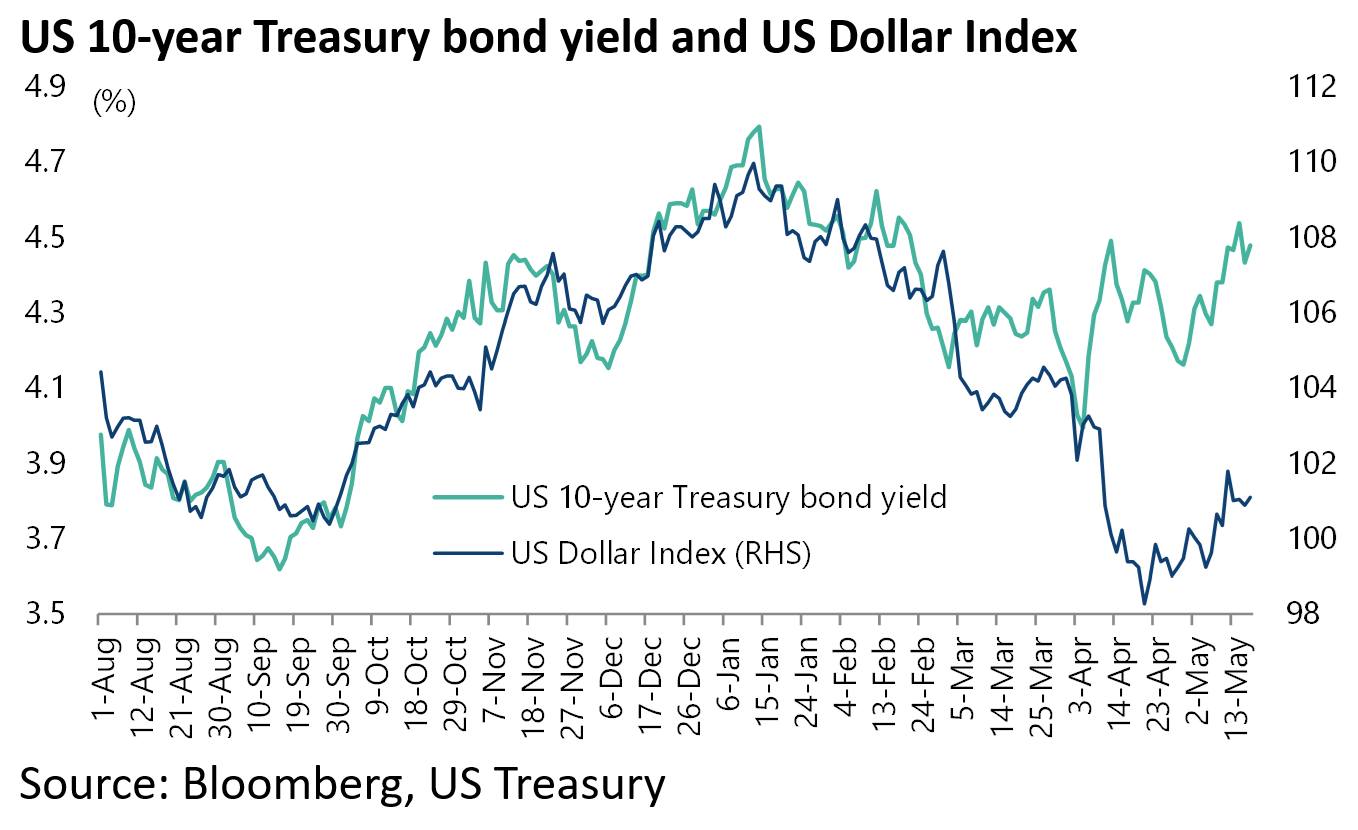
Still what has been really interesting of late was the extremely unusual weakness of the US dollar amidst risk-off market action and also the back up in long-term Treasury bond yields at the same time as the US stock market had clearly been signaling rising concerns about a US recession triggered by the tariff agenda.
This has raised the issue again of whether supply concerns are again driving Treasury bond yields.
This not only undermines risk-parity strategies.
But it also, much more importantly, questions the supposed “risk free” status of Treasury bonds and with it the US dollar’s status as the reserve currency of the world.
True, there have been other plausible explanations of the sell-off in Treasuries.
Basis Trade, Not China, Likely Driving Treasury Selloff
One such is retaliatory Chinese dumping of Treasury bond holdings.
Still this writer doubts this despite the massive provocation of a 125% tariff levied against China announced on 9 April, in additional to the 20% fentanyl-related tariffs announced in 1Q25.
The other more plausible explanation is forced selling triggered by highly leveraged players in the so called “basis” trade where absolute-return investors seek to make money out of arbitraging the difference between cash and future prices.
Such arbitrage strategies have accounted for a growing share of ownership of Treasury bonds which is obviously not healthy.
On this point, hedge funds’ long and short US Treasury exposures have increased from US$1.0trn and US$694bn respectively at the end of 2022 to US$1.86trn and US$1.42trn at the end of 2024, according to the Office of Financial Research.

Meanwhile, according to a report by the Fed, the average leverage employed in 2019 was 21x for the large participants in the basis trade.
The trade is now estimated to be roughly US$1trn in size, about 2x from what it was going into the Covid sell-off.
No Deal on China Tariffs Still the Largest Near Term Risk to Equities
Still if the current sell-off does not necessarily indicate that supply concerns are hitting the Treasury bond market, that day is coming sooner or later so long as the US fiscal situation continues to deteriorate, which again has become the base case given Elon Musk’s seemingly imminent departure from Washington and DOGE.
Meanwhile, Elon Musk’s tweets on 8 April attacking Trump’s top trade adviser Peter Navarro made clear what has always been assumed, namely that Musk is no fan of tariffs.
Yet he has clearly so far not managed to persuade Trump not to indulge in his longstanding obsession, dating back to the late 1980s, with tariffs.
Still the market is now assuming that the 90-day pause on the so-called “reciprocal” tariffs, ending on 9 July with the exception of China, will become permanent.
This would mean that a universal 10% tariff will be applied to all countries other than China for 90 days and beyond.
As for China, investors are also increasingly assuming that the additional tariffs will not be reimposed after the 90-day pause in the case of China ends on 12 August.
That means the formal tariff on China will remain 40% but that includes 20% related to the fentanyl issue and the 10% left over from the first Trump administration.
On this point, this writer can also easily see the 20% being negotiated away on some declared progress on fentanyl in another future deal with China.
If this base case is wrong, and Trump resumes with the reciprocal tariffs after the 90-day pause, it would clearly be bearish for equities.
The hope would then be that the free market inclined Republicans in Congress, and there are probably quite a lot of them, look to assert Congress’ role to have some say in the tariff issue.
These are the people, like this writer, who believe in such classic notions as “the law of comparative advantage”, and “the division of labour”.
Meanwhile, one core problem of tariffs for the American economy is that tariffs amount to a regressive tax on ordinary Americans.
This writer’s guess is that many American Trump supporters believe tariffs are paid by the exporters, not by the American buyers of the goods.
Private Markets Have No Exit Ramp
Meanwhile, the recent risk-off action triggered by the Trump tariff agenda served to dash hopes, for now at least, of a revival in the IPO market which were prevalent following the election of Donald Trump with the bullish part of his agenda, namely deregulation and tax cuts.
This is why it was not surprising to read an article last month reporting that discounts were rising again in the secondary market for private equity funds, for those investors who want to exit “locked-up private equity funds” in order to raise liquidity (see Financial Times article: “Big investors look to sell out of private equity after market rout”, 7 April 2025).
Remember that a Bain & Co. report issued early last year estimated that the private equity industry had 28,000 companies it wanted to list globally (see Bain & Co. report: “Global Private Equity Report 2024”, 11 March 2024), as discussed here previously (see Grizzle article: “Tracking Three Risks That Could Sink Markets: Oil, Geopolitics and Private Debt”, 13 May 2024).
The latest Bain report published in March this year now puts that same number at 29,000 (see Bain & Co. report: “Global Private Equity Report 2025”, 3 March 2025).
This remains the biggest pipeline in the history of corporate finance.
The same report also estimated that the private equity industry’s assets dropped last year for the first time in decades as fundraising declined by 23% from the 2023 levels.


The question is whether this is just the beginning of a downturn in the “private” space, as institutional investors are forced to come to terms with the “illiquidity” of so-called alternative investments.
US Colleges Heavily Exposed to Any Problems in Private Markets
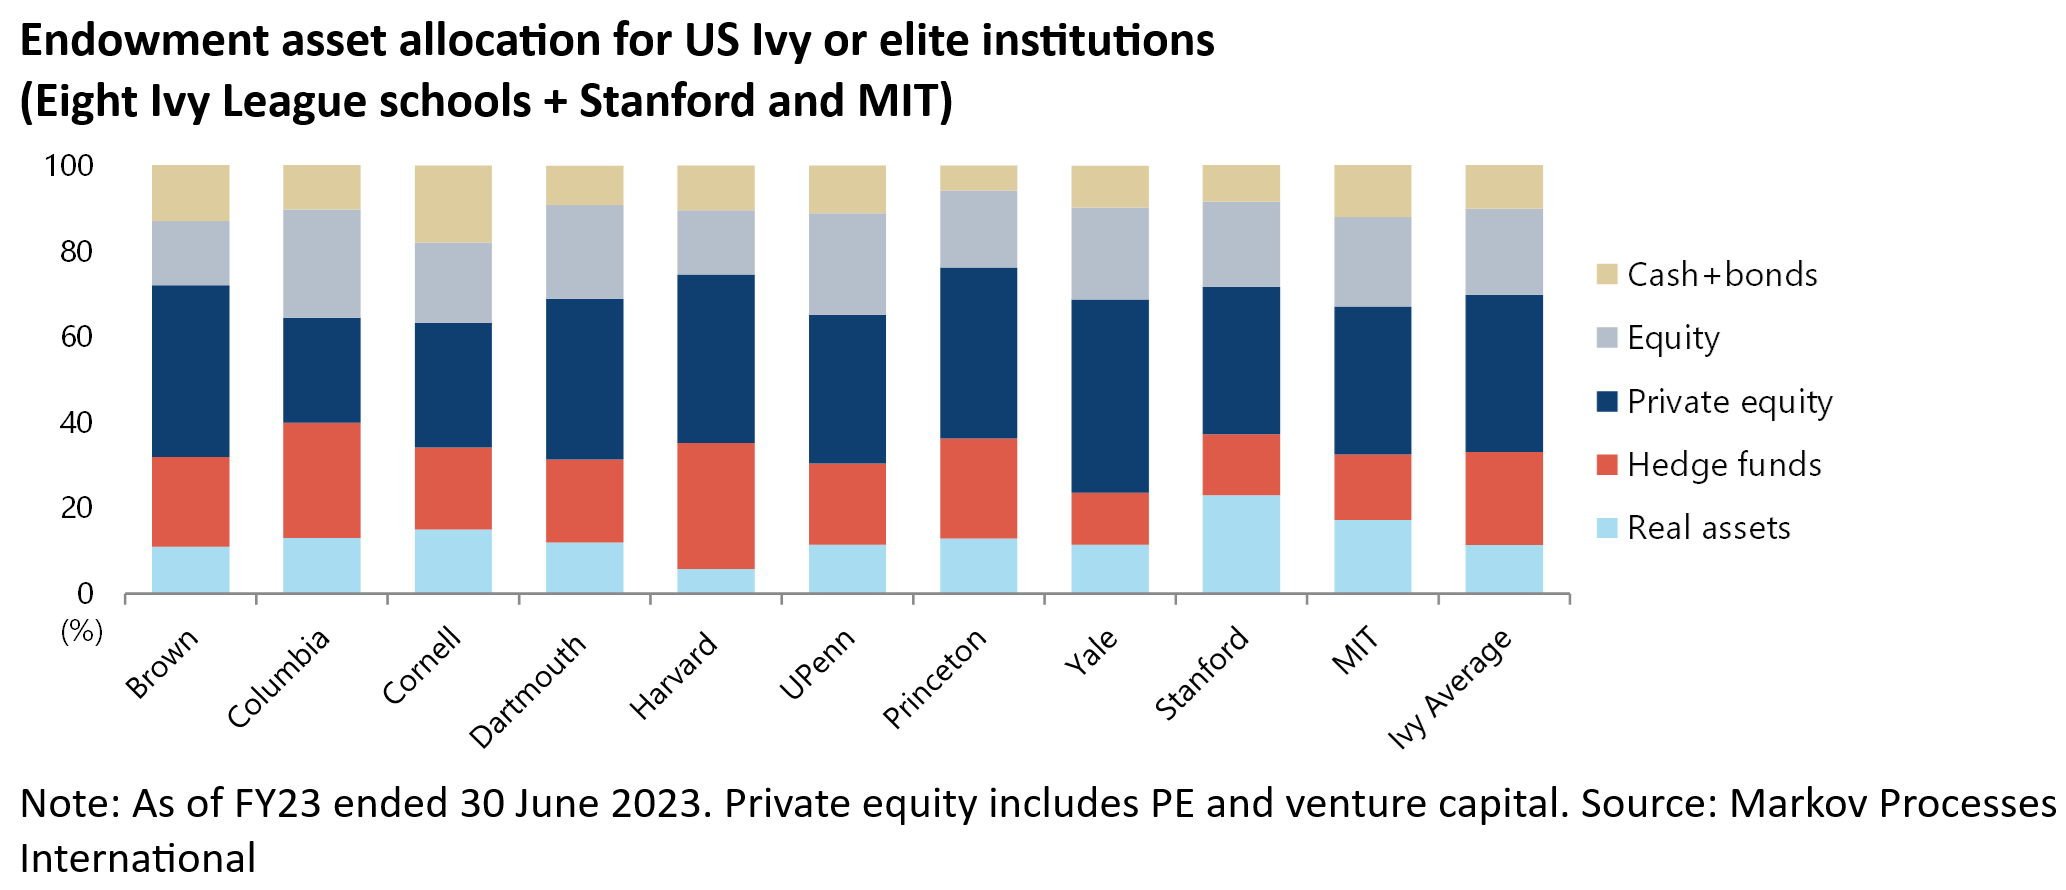
On this point, it is worth highlighting again a very interesting study on US Ivy League endowments’ massive exposure to the alternative assets discussed here last year (see Grizzle article: “The Asset Class That Could Stoke the Flames of a Stock Market Selloff”, 26 September 2024 and Markov Processes International report: “A Private Equity Liquidity Squeeze By Any Other Name”, 15 July 2024).
The Markov report estimated that at the end of fiscal year 2023, which is apparently 30 June for such institutions, the average Ivy League institution had 36.7% of its endowment in private equity (defined as PE and venture capital) based on an analysis of annual reports and financial statements.
While another 21.7% were allocated to hedge funds and 11.4% to real estate assets.
This compared with only about 30% allocated to more liquid asset classes of which stocks comprised about 20% and cash and bonds 10.5%.
As for a broader universe of US endowments, the report also noted that, based on a 2023 NACUBO-Commonfund Study of Endowments published by the National Association of College and University Business Officers (NACUBO), 29% of the US$839bn in endowment assets of 688 surveyed colleges and universities were allocated to private equity (17% in PE and 12% in VC) at the end of FY23.
If the allocation of 16% to hedge funds and 11% to real assets such as property is added, then the asset allocation is over 50% to what the Markov study describes as “alternatives of various illiquidity levels”.
There has since been an updated NACUBO report published in February.
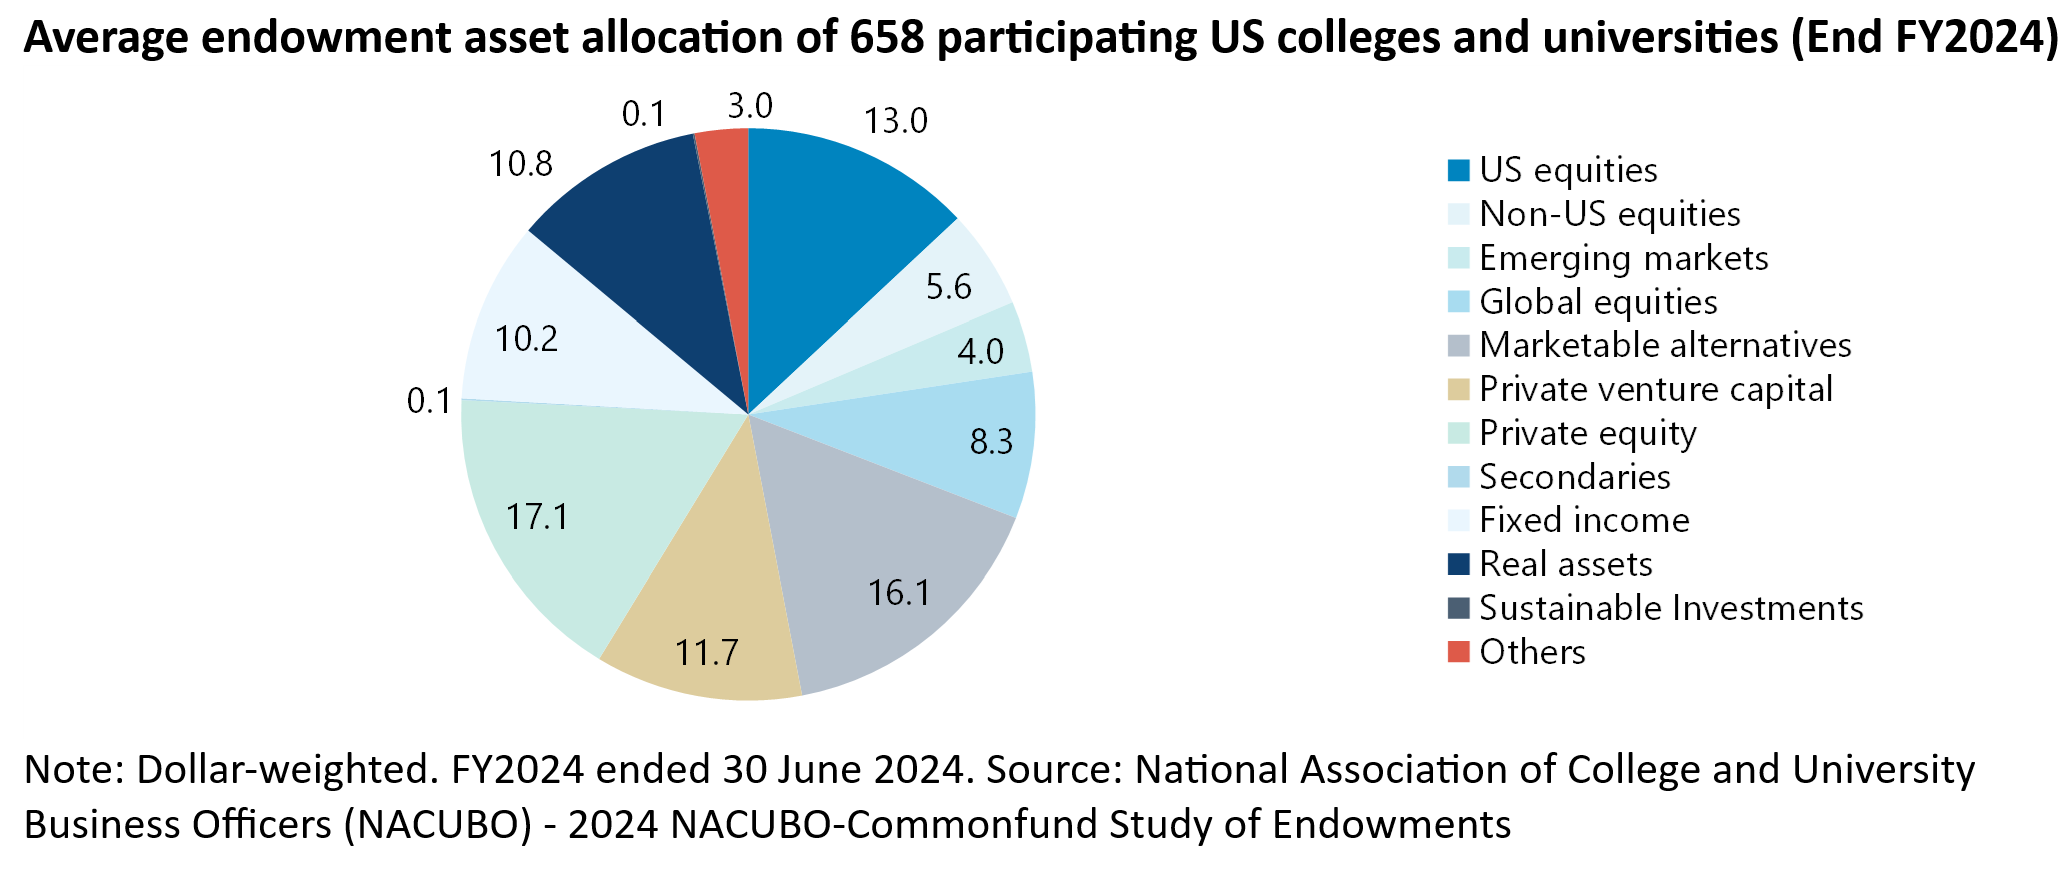
This also shows a similar asset allocation at the end of FY24 ended 30 June 2024 (see NACUBO report: “2024 NACUBO-Commonfund Study of Endowments”, 12 February 2025).
Thus, alternative investment strategies, including private equity, hedge funds and real assets, remained the largest allocation at 55.7% of the US$874bn in endowment assets of 658 surveyed colleges and universities.
This included 17.1% to private equity, 16.1% to marketable alternatives (hedge funds), 11.7% to venture capital and 10.8% to real estate assets.
This massive exposure to fundamentally illiquid markets would seem extremely reckless.
It also shows the insanity of the recent obsession with defining volatility as “risk”, which obviously means that securities traded every day are always going to look more “risky” than assets that are not marked to market.