Treasury Yields are Falling But Don't Be Fooled
The Bond Bear Market Trudges On...
Author: Chris Wood
The Treasury bond market has been rallying of late on softer US data.
This can continue for now…
Still the view here remains that US Treasuries are in a structural bear market and that the extraordinary outperformance of emerging market government bonds since the Covid-triggered Fed monetary expansion in March 2020 is a sign that markets have started to question the assumption that Treasury and other G7 government bonds are “risk free”.
Such a development has geopolitical, as well as financial, implications for obvious reasons.
Meanwhile, this writer certainly does not view them as risk free.
Still it is only fair to acknowledge that there is a belief in some circles that the growing ownership of G7 government bond market by the same country’s central bank is a support to the system as a whole, as G7 central banks have expanded the use of their balance sheets in the post-2008 era.
Remember that this is a policy which began as a response to an emergency, namely the financial crisis, and morphed into a policy of pragmatic convenience.
The Fed, the Bank of Japan, the ECB and the Bank of England now own US$4.44tn, Y588tn (US$3.66tn), €3.88tn (US$4.16tn) and £693bn (US$884bn) of their own government bond markets.
Now it is clear that the central bank buying of government bonds, be it the Fed buying Treasuries or the Bank of England buying gilts, is a support to the relevant government bond market.
But this writer views it as akin to providing an addict with morphine, which is clearly not so healthy.
For the growing involvement of central banks funding the spending of the relevant finance ministry is self-evidently unhealthy, in terms of the ever greater blurring of the distinction between fiscal and monetary policy.
To believe otherwise is to believe in a free lunch. And the writer does not believe in free lunches, though it must be admitted they can be extended for a while.
It is true that the blurring of the distinction between monetary and fiscal policy has been taken to its most extreme in Japan.
But Japan, unlike the US, is not dependent on foreign creditors.
Meanwhile the lack of a free lunch is already clear to investors in Treasury bonds.
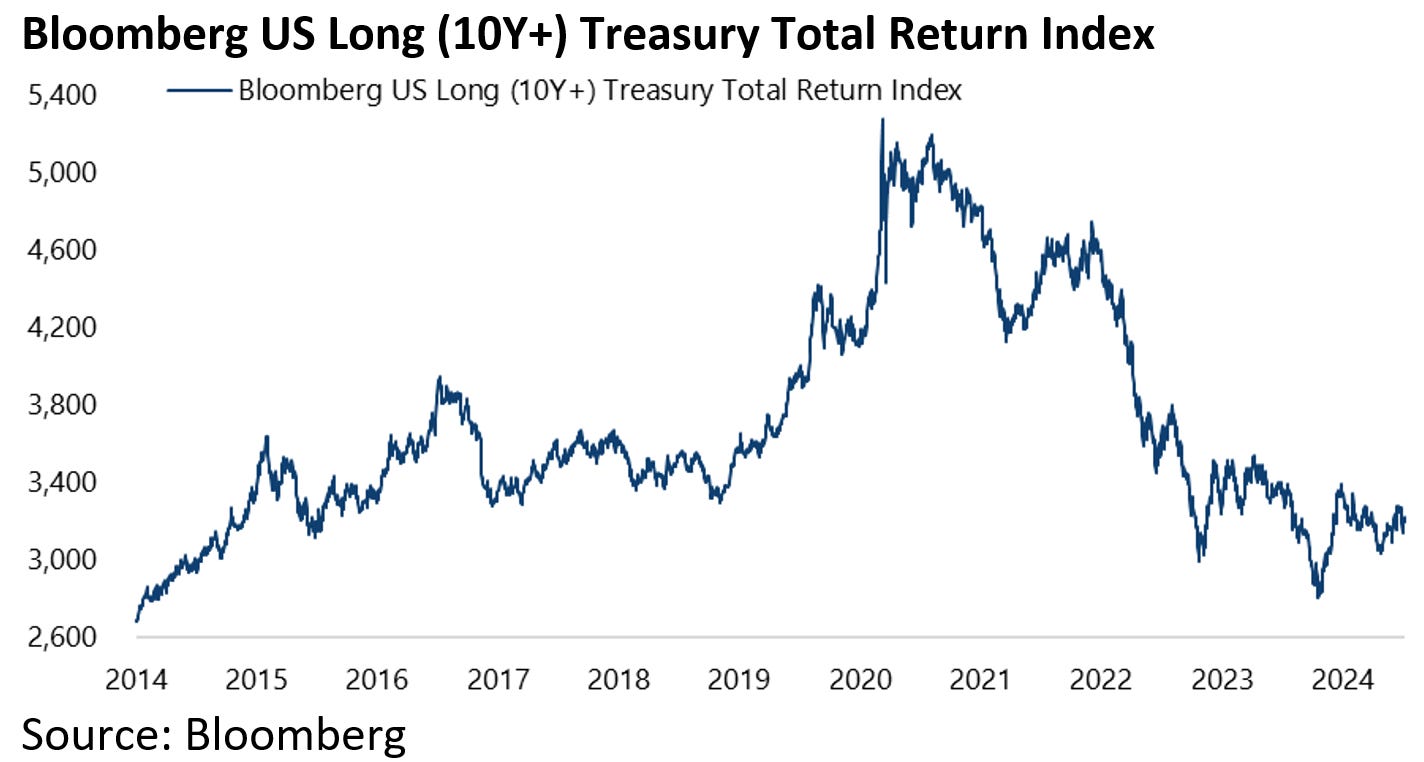
The Bloomberg US Long (10Y+) Treasury Bond Index has declined by 39% since yields bottomed in March 2020.
Back in March 2020 the index’s market value was US$2.24tn, which means it has lost US$874bn in value since then.
Meanwhile, the chart below shows the trend line on the 10-year Treasury bond yield since the bull market began back in 1981.
The trend line is now at around 2.6% which means that Treasuries can rally to that level and still be in a bear market following the breaching of that trend line in August 2022.
The Cost of Government Debt is Rising
Staying on the topic of US fiscal policy, it is worth noting the source of the data on the federal government’s net interest payments as a percentage of government receipts seen in the chart below.
The data used here is obtained from the Treasury’s Monthly Treasury Statement on federal government receipts and outlays.
And, importantly, the denominator is the total federal government receipts as opposed to just tax receipts which account for about 64% of the total.
The data shows that annualised net interest payments totaled US$836bn in the 12 months to May, while annualised federal government receipts totaled US$4.73tn over the same period of which tax receipts accounted for US$3.02tn.
As a result, annualised net interest payments as a percentage of total federal government receipts rose to 17.7% in May, the highest level since April 1993.
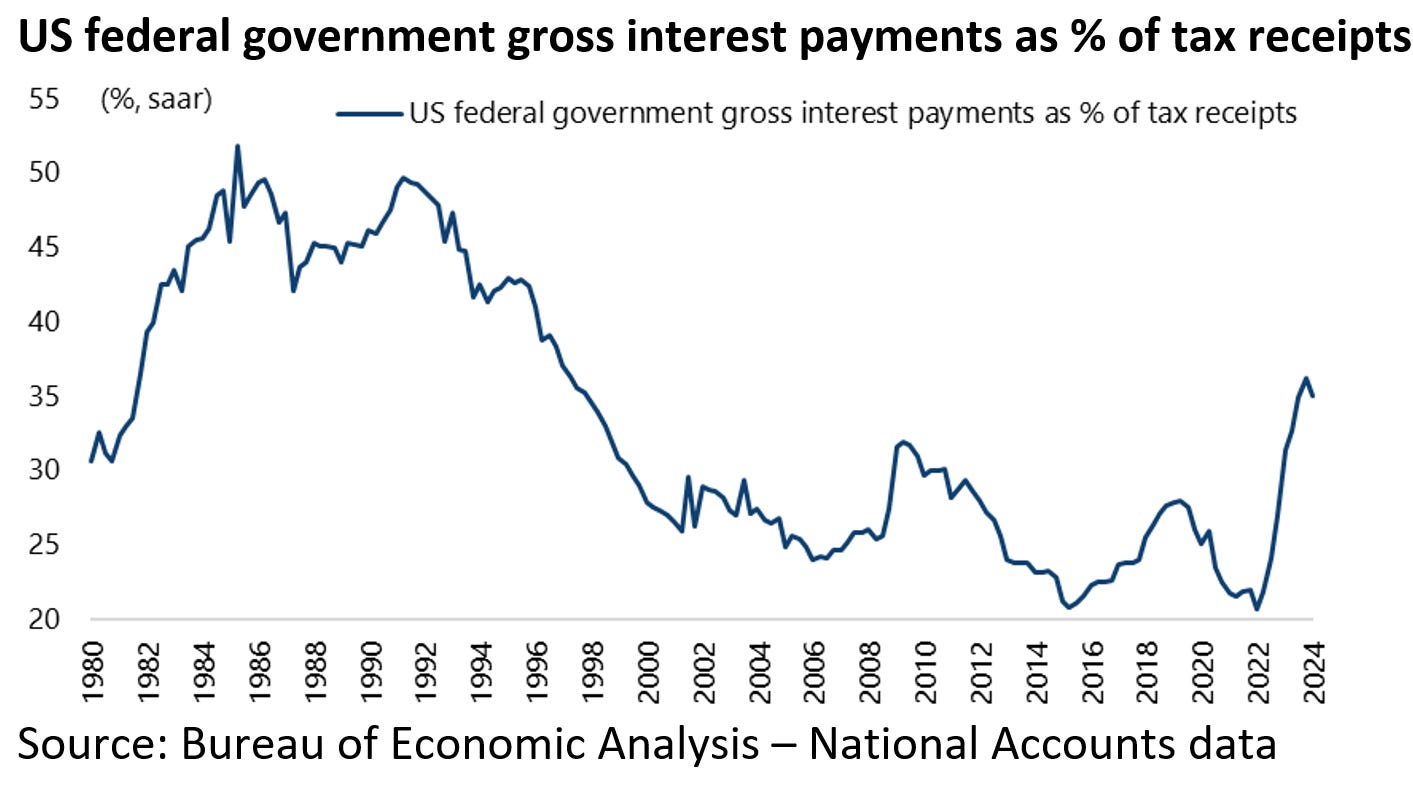
The Bureau of Economic Analysis’ national accounts data also shows that gross interest payments amounted to 36.2% of federal government tax receipts in 4Q23 on a seasonally adjusted basis, the highest level since 2Q97, and was 35% in 1Q24.
Based on the national accounts data, gross and net interest payments were a seasonally adjusted annualised US$1.06tn and US$1.01tn respectively in 1Q24, while total receipts and tax receipts totaled US$5.05tn and US$3.03tn.
Gold Breaking Out Even Without a Big Surge in Buying From China
Meanwhile, the Gold bullion price is up 16% year to date after rising by 13.1% last year.
It is worth noting that some hard data on physical gold demand in China does not show any dramatic surge in purchases coinciding with gold’s recent breakout to a new high.
On retail gold jewelry demand, the National Bureau of Statistics’ retail sales data shows that retail sales value of “gold, silver and jewelry” at enterprises above the designated size rose by only 0.9% YoY to Rmb145.8bn in the first five months of 2024, after rising by 13.3% YoY to a record Rmb331bn in 2023.
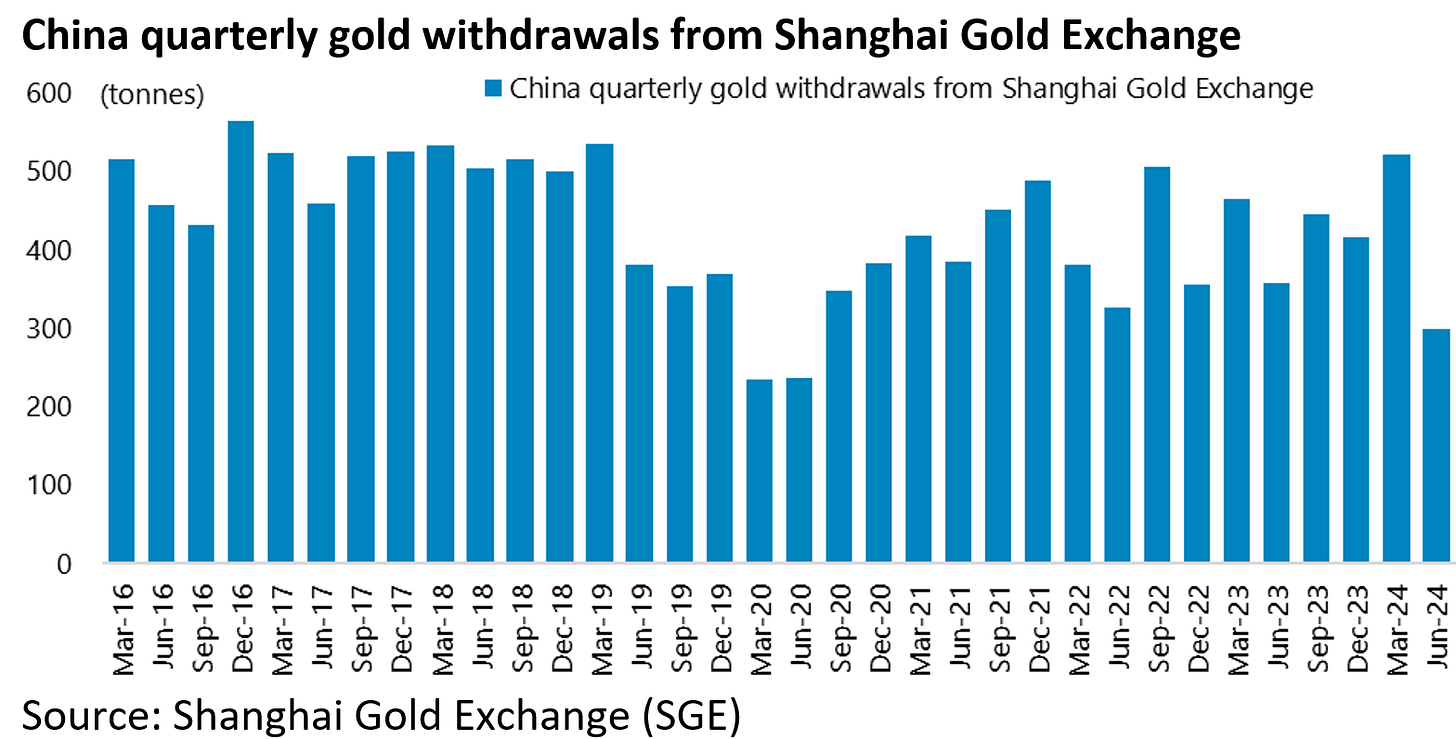
While Shanghai Gold Exchange (SGE) data shows wholesale gold demand in 1Q24 rose to the strongest level since 2019, the increase was again not dramatic.
Gold withdrawals from the SGE rose by 12.3% YoY to 522 tonnes in 1Q24, the highest quarterly level since 1Q19 (536 tonnes).
Indeed gold withdrawals from the SGE declined by 16.5% YoY to 300 tonnes in 2Q24.
Still where there was a marked surge in gold demand, albeit of a speculative nature, has been on the Shanghai Futures Exchange.
The Shanghai Futures Exchange’s gold futures aggregate daily trading volume almost tripled from an average of 225,442 contracts/day in the 12 months to March to an average of 533,813 contracts/day in April, peaking at 1.2m contracts on 15 April, though it has since declined to a daily average of 223,453 contracts in June and 169,520 contracts so far in July.
Meanwhile gold in Shanghai continues to trade at a premium.
The Shanghai gold price is now trading at a US$22/oz premium to the international gold price, after reaching a record US$121/oz premium last September.


