The Two Big Risks for Stocks in 2025

Author: Chris Wood
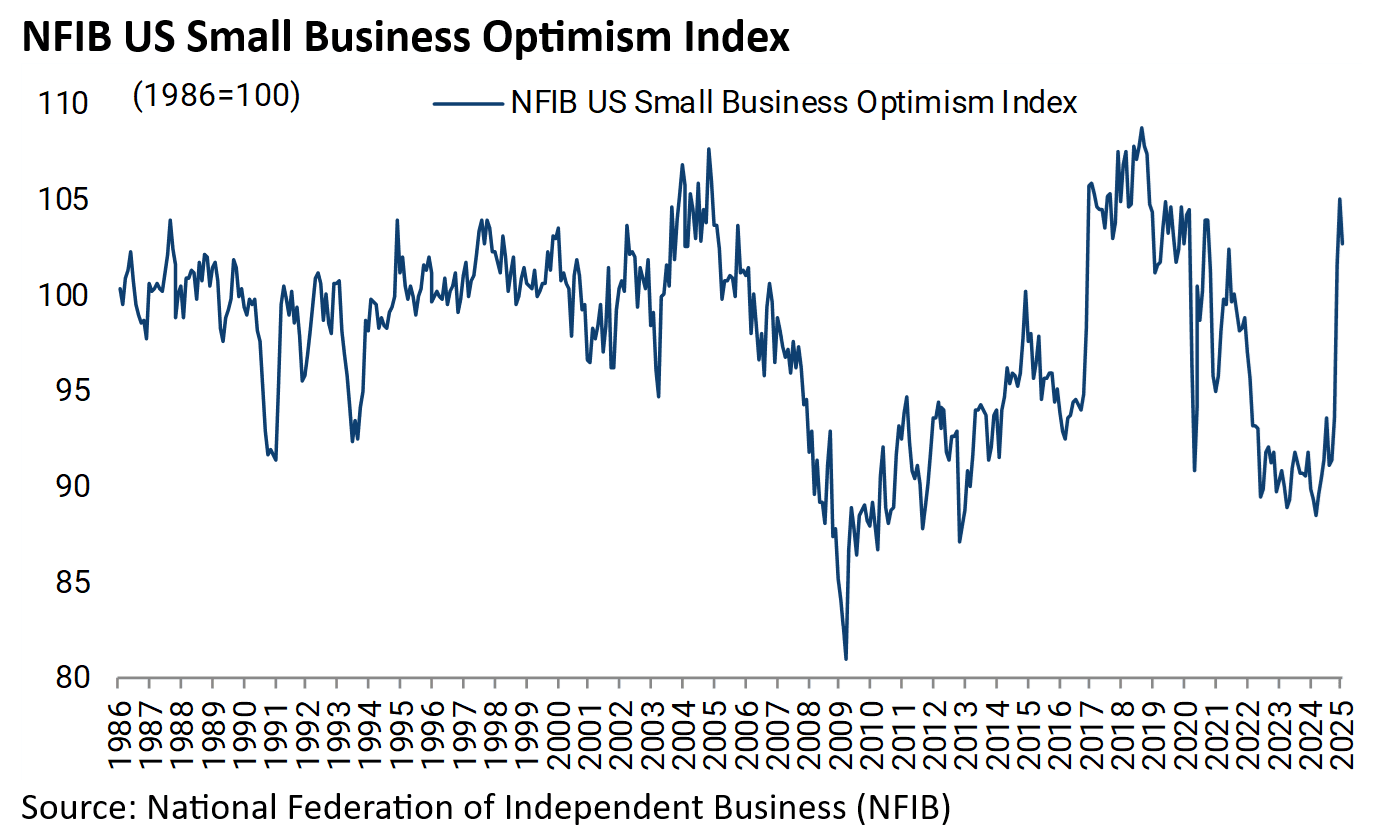
US inflation data has become important again given Jerome Powell’s hawkish pivot at the December meeting and the more pro-cyclical sentiment following the election of Donald Trump and the resulting vertical surge in the small business confidence index.
The NFIB small business optimism index rose by 11.4 points from 93.7 in October to 105.1 in December, the highest level since October 2018, though it fell to 102.8 in January.
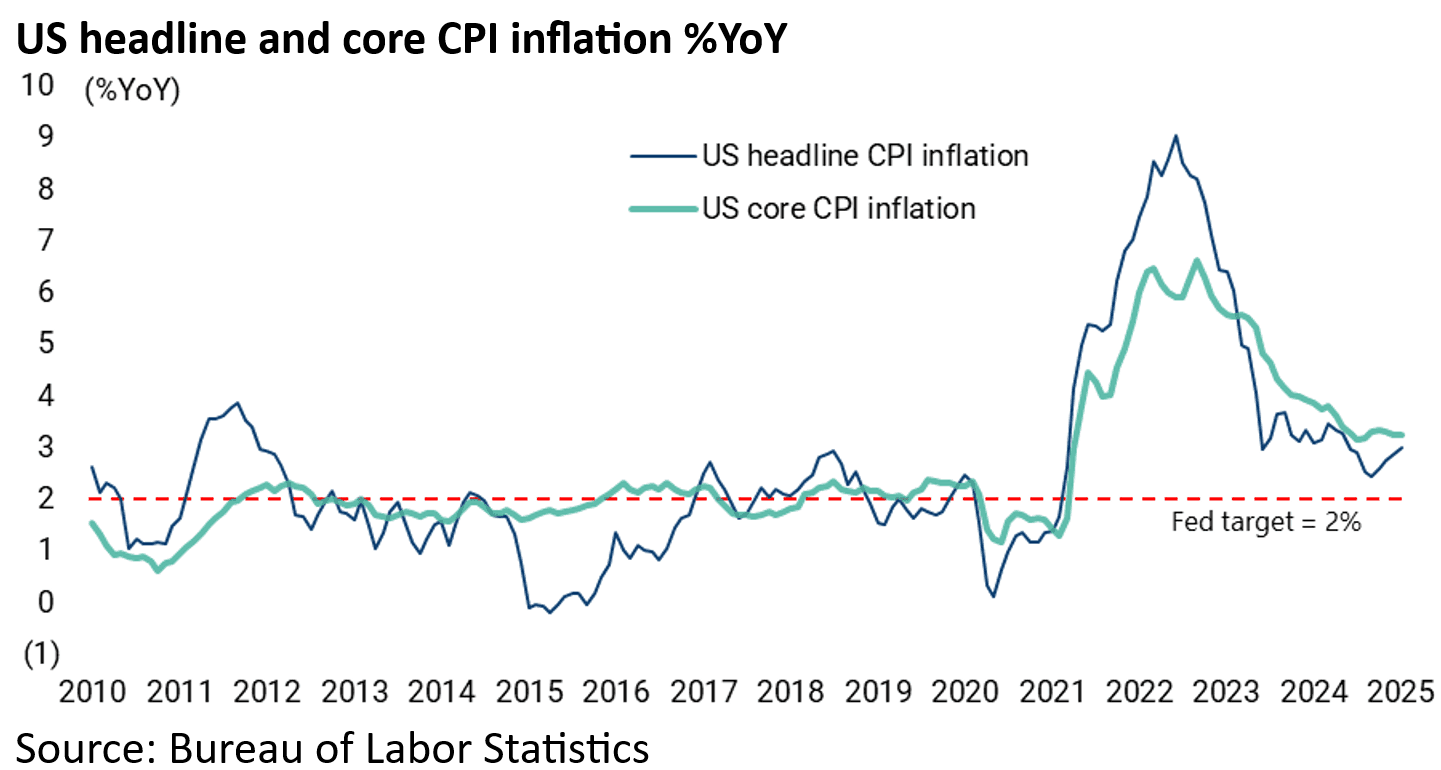
As regards the inflation data itself, the key point is that the month-on-month trend has been rising. This is not alarming as yet. But it certainly bears watching.
Headline CPI and core CPI rose by 0.5% MoM and 0.4% MoM in January, up from 0.0% and 0.1% MoM respectively in June.

As a result, the three-month annualised rates of headline and core CPI have risen from 0.7% and 1.7% respectively in July to 4.5% and 3.8% in January.

On a year-on-year basis, headline CPI inflation rose from 2.4% YoY in September to 3.0% YoY in January, while core CPI inflation rose from 3.2% YoY in August to 3.3% YoY in January.
So, for now, the case for remaining structurally bearish on Treasury bonds remains straightforward absent dramatic surgery from Elon Musk and the DOGE.
The latest data highlighting fiscal deterioration shows that net interest payments and entitlements were 96% of total government receipts in the 12 months to January.

Bond Yields and AI CAPEX the Big Risk for Stocks in 2025
As for the US stock market, one risk for equities is clearly that at some point the stock market will not be able to ignore rising bond yields, though it also has to be admitted that it has done a very good job so far of doing just that.
The 10-year Treasury bond yield is currently 83bp above where it was when the Fed resumed easing last September.
Another risk for US equities in 2025, given the continuing dominance of the Big Tech stocks in the S&P500, remains that markets start to question the monetisation of AI, or the lack of it, given the huge amounts being spent by the hyperscalers investing in so-called machine learning capacity.
Annual capex of the four major hyperscalers, namely, Microsoft, Amazon, Google and Meta Platforms, rose by 55% YoY to US$228bn in 2024.
Based on the guidance provided by the companies in the latest quarterly earnings season, they are now on course to invest US$320bn in capex this year.

There remains great confidence that the AI capex arms race will continue in 2025 on the view that the hyperscalers have no choice since they cannot afford to be left behind even after the shock provided by DeepSeek.
China AI startup DeepSeek reportedly spent only “under US$6m” to train its AI model.
Moreover, DeepSeek’s R1 model, released in late January, is open sourced which means anyone can tap into it or use it for free (i.e. it can be replicated).
For more on this read a detailed article in a recent Economist (see The Economist article: “China's AI industry has almost caught up with America's”, 23 January 2025).
Still the central issue remains whether investors will start to question this spending.
On this point, one major positive feature of these Big Tech stocks for investors in recent years has been their free cashflow generation.
Another was that they each operated in their own segment or vertical, or what is fashionably called a “moat”.
But they are now draining that moat, in terms of the amount of cash being spent, while when it comes to AI they are increasingly, so far as this writer can tell, competing directly with each other.
Another issue is the breakdown of where that capex is being spent, in terms of semiconductors or data centers for example.
In terms of the macro data, the chart below shows a spike in the private construction of data centers, which is part of the “office” category.
Thus, private construction spending for data centers has risen by an annualised 51% over the past two years from a seasonally adjusted annual rate of US$14.3bn in December 2022 to US$32.6bn in December 2024.
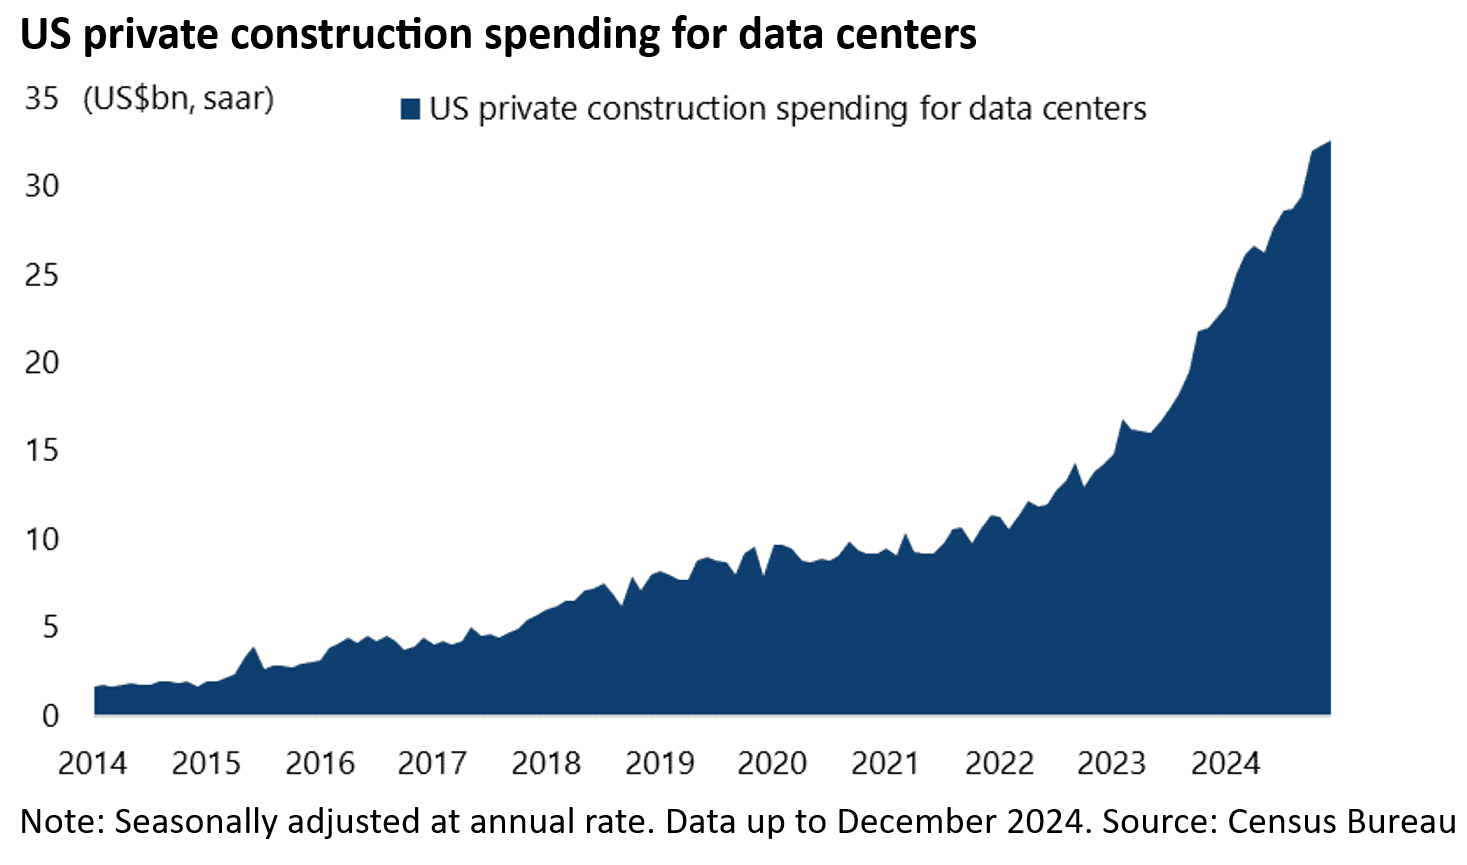
As a result, it now accounts for 38% of private office construction, up from 17% in December 2022.
This compares with an annualised US$236bn spent on private construction of factories in December, of which US$125bn or 53% was accounted for by the computer, electronics and electrical manufacturing sector.

A further relevant issue is how this spending is accounted for in terms of depreciation schedules and the like.
Given the aggressive accounting standards employed in America, the base case is that the hyperscalers will be in no hurry to pay for it. This means the impact on free cash flow generation can be delayed.
On this point, Meta extended in January the expected life of its servers and network assets by six months to five and a half years, which will reduce its 2025 depreciation expenses by approximately US$2.9bn.
This compares with the expected server and network equipment life of six years for Microsoft, Google and Amazon.
Still the example of Meta, when its share price reacted very negatively to the deterioration in free cash flow triggered by its investment in the Metaverse back in 2022, shows that these stocks will remain very sensitive to the deterioration in free cash flow which is the natural consequence of the AI arms race.

American's Exposure to US Stocks Is Too High
If this is a key issue for the US stock market in the coming year, in the sense of the monetization of AI or the lack thereof, the practical reality for now as previously discussed here (Bubble or bull market – Trump will decide, 19 January 2025) remains that there is essentially no interest in America in investing in equities outside America so great is the confidence in the domestic story amidst much chatter about “American exceptionalism”.
This is despite the fact that America only accounts for 15% of world GDP on a PPP basis and 14% of world GDP growth.
This is clearly a little absurd.
Still even more absurd is that the so-called Magnificent Seven, comprising Apple, Microsoft, Alphabet (Google), Amazon, Nvidia, Meta Platforms and Tesla, accounted for 22.1% of MSCI AC World at the recent peak in late December.
While America reached an all-time peak of 47.2% of MSCI AC World on 24 December last year.
The Magnificent Seven now account for 20.7% of MSCI AC World while MSCI USA accounts for 66.1%.
Confidence in Stocks is High Despite the Worsening Fiscal Situation
This huge confidence in the dynamism of the US corporate sector contrasts dramatically with America’s fiscal predicament.
And it is certainly the case that listed US corporates have done an excellent job in terms of preserving profit margins even as top line growth has slowed in recent quarters.
S&P500 annualised sales rose by 5.9% YoY in the four quarters to 3Q24, down from 16% YoY in the four quarters to 1Q22.
As for profit margins, S&P500 annualised as-reported earnings as a percentage of sales rose from 9.8% in 1Q23 to 10.3% in 3Q24.

Still, it is also the case that the biggest driver of US equity performance last year was multiple expansion rather than earnings growth.
The S&P500 12-month trailing operating PE rose by 12.5% from 22.3x at the end of 2023 to 25.1x at the end of 2024, with a forecast operating earnings growth of 9.6%.
The S&P500 now trades at 22.8x forecast 2025 operating earnings assuming 15% consensus earnings growth.
Did Anyone Notice Europe and China are Outperforming American Stocks Year to Date?
Meanwhile it is worth highlighting that both Europe and China are outperforming year to date while America is underperforming.
MSCI Europe and MSCI China have risen by 10.7% and 13.2% in US dollar terms respectively so far in 2025, while MSCI USA and MSCI AC World are up 4.2% and 5.1% over the same period.
Europe reached all time valuation low relative to America last November on a forward PE basis while China also remains cheap.
MSCI Europe now trades at 14.5x 12-month forward earnings or a 36% discount to the MSCI USA 12-month forward PE of 22.6x, compared with a record 43% discount in mid-November.

While MSCI China trades at 11.2x 12-month forward earnings, though up from 8.2x in January 2024.