Is the Fed about to Propel Gold to $6,000/oz?
Author: Chris Wood
The price of gold bullion has bounced back in recent days amidst Silicon Valley Bank-related bank concerns in the US as Fed tightening expectations have once again been revised down.
The money markets are now discounting only 21bp of rate hikes to 4.79% on the Fed funds effective rate by early May, down sharply from a peak terminal rate of 5.69% reached on 8 March when the Fed funds rate was expected to peak in the September FOMC meeting.
FED FUNDS FUTURES IMPLIED RATES FOR MAY AND SEPTEMBER FOMC MEETINGS
Source: Bloomberg
Still, the move in gold, up 9.1% year to date and up 23.2% from the bottom last year reached in late September, has not yet triggered a renewed inflow into gold ETFs.
GOLD BULLION PRICE
Source: Bloomberg
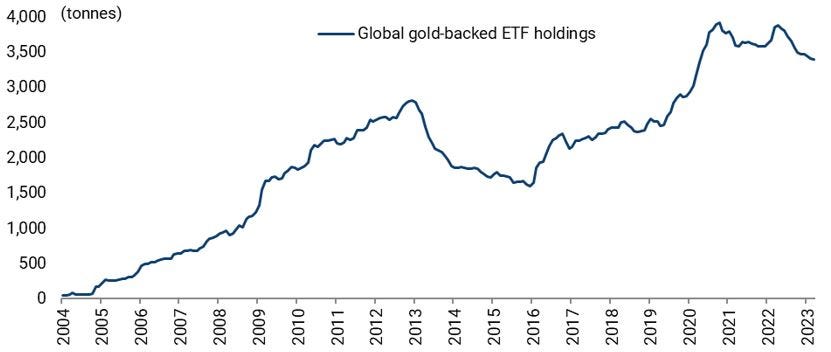
Indeed, global gold ETF holdings have declined by 77.9 tonnes so far this year to 3,394.6 tonnes as of 10 March, according to the World Gold Council.
GLOBAL GOLD-BACKED ETF HOLDINGS
Note: Data up to 10 March 2023. Source: World Gold Council
The lack of inflows is notable following the outflow that hit gold ETFs last year.
Global gold ETF holdings declined by 428.1 tonnes last year from the peak of 3,900.6 tonnes reached in late April to 3,472.5 tonnes at the end of 2022.
In this context, inflation has begun to trend down.
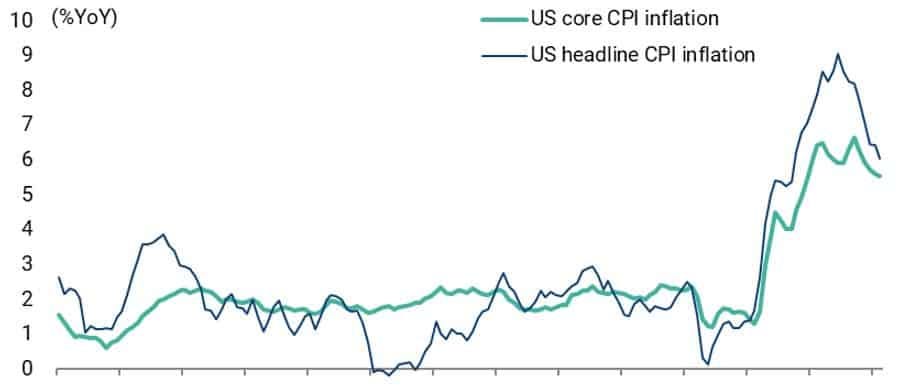
Headline CPI inflation and core CPI inflation slowed from 6.4% YoY and 5.6% YoY respectively in January to 6.0% YoY and 5.5% YoY in February, both in line with consensus expectations.
US HEADLINE AND CORE CPI INFLATION
Source: US Bureau of Labor Statistics
Still, the problem for the Fed is that core services inflation rose from 7.2% YoY in January to 7.3% YoY in February, the highest level since August 1982, with shelter CPI rising to 8.1% YoY.
If shelter, a lagging indicator, is taken out, core services inflation was still flat at 6.0% YoY in February though down from a peak of 6.6% YoY in September.
US CORE SERVICES CPI AND SHELTER CPI INFLATION
Source: US Bureau of Labor Statistics
Any renewed correction in gold should be viewed as a buying opportunity on this writer’s base case, namely that a recession is coming in America along with a change in Fed policy.
WHO IS THE MARGINAL GOLD BUYER?
Meanwhile, if renewed inflows into ETFs are what is needed to confirm a new bullish trend in gold, if ETFs have not been the marginal buyers of gold of late the question is who has been.
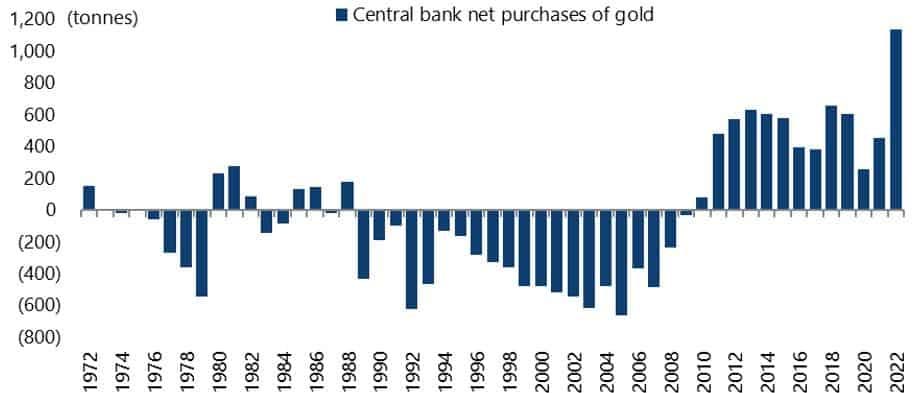
On this point, data from the World Gold Council shows that central banks were big buyers of gold last year.
They purchased 1,135.7 tonnes in 2022, the highest level in more than 50 years, with a net buying of 862.2 tonnes in 2H22.
CENTRAL BANKS’ ANNUAL NET BUYING OF GOLD
Source: World Gold Council
This buying has not got the attention it merits.
This writer is assuming that the buying comes from central banks outside the G7 world, with one obvious trigger the unprecedented decision by America in March 2022 to freeze 47% or US$300bn of Russian foreign exchange reserves.
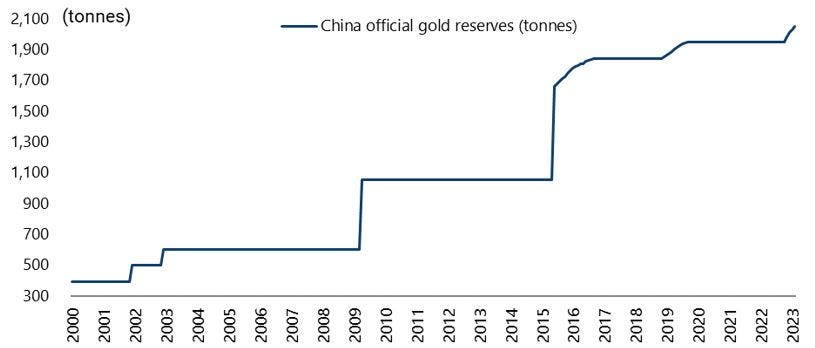
There is a lot of speculation of how much gold the People’s Bank of China bought last year, though there is a lack of concrete data. Certainly, the PBOC did not report any change in gold reserves in its monthly foreign exchange reserves data in the period between September 2019 and October 2022, though it has since reported that China’s official gold reserves increased by 3.28m oz or 102 tonnes in the period between November 2022 and February 2023 to 65.92m oz or 2,050 tonnes at the end of February.
CHINA OFFICIAL GOLD RESERVES
Source: PBOC
On a related subject, it is also worth noting that the Russian Ministry of Finance said on 30 December that it will raise the permitted allocation to gold in its US$186.5bn National Wealth Fund to 40% of the fund, double the previous limit of 20%.
Meanwhile, it is worth recording again that gold behaved remarkably well last year given the twin realities of a strong US dollar and the most aggressive Fed monetary tightening cycle in 40 years.
Gold declined by only 0.3% in US dollar terms in 2022 and so proved its worth as a preserver of capital compared with the significant declines in both equities and Treasury bonds.
The S&P500 declined by 18.1% on a total-return basis last year while the Bloomberg long-term (10-year+) Treasury bond index was down 29.3%.
True, it was a different story with higher-beta gold-mining stocks, with the unhedged gold mining index declining by 11.2% last year.
NYSE ARCA GOLD BUGS INDEX
Source: Bloomberg
Still, even that index was an outperformer relative to most other equity indices.
The MSCI AC World Index was down 19.8% in 2022, for example.
Meanwhile, gold mining stocks are now up 40% from the low reached in late September.
IS $5,800/oz GOLD ON THE HORIZON?
Finally, one way of gauging the potential of gold to rise in a bull market remains comparing the January 1980 peak gold price of US$850/oz with the increase in US nominal personal disposable income per capita since then.
The gold price was then equivalent to 9.9% of US personal disposable income per capita, which was US$8,547.
The gold price is now US$1,989/oz or 3.4% of US disposable income per capita of US$58,573.
GOLD PRICE AS % OF US PERSONAL DISPOSABLE INCOME PER CAPITA
Note: Adjusted to show the peak ratio in January 1980 based on then peak gold price of US$850/oz.
Source: US Bureau of Economic Analysis, Bloomberg
To reach 9.9% of US disposable income per capita now would mean gold rising to US$5,825/oz in a new bull market
.


