
Grizzle Growth ETF: 2026 Semiannual Letter

2026 Half-Year Performance Review
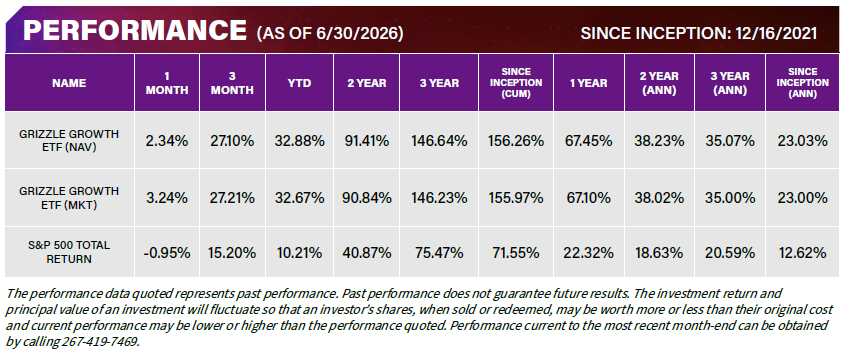
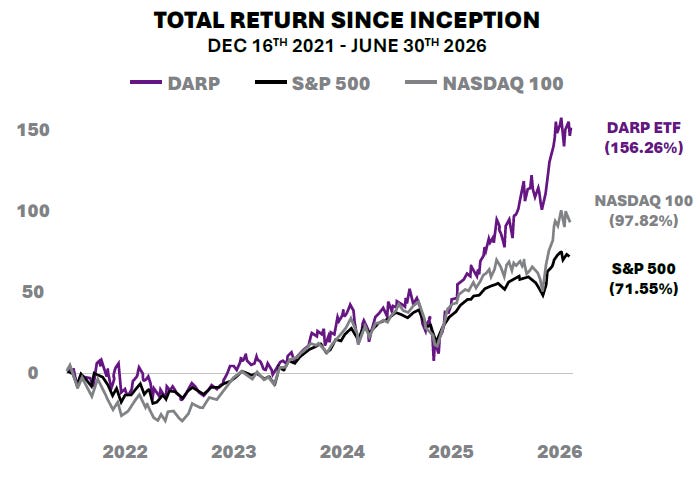
The Grizzle Growth ETF (DARP) returned 32.88% in the first half of 2026, more than triple the S&P 500’s 10.21%. That performance places the fund in the 3rd percentile of the Morningstar US Large Cap Growth Category* YTD, and in the 3rd percentile on a trailing three-year basis, with a three-year annualized return of 35.07%. Consistency across the one-year and three-year windows reflects the durability of the process, not a single strong quarter.
That process was tested early in the year. Q1 opened strongly before markets sold off sharply, with DARP holding a positive return through that drawdown while the broader market posted a loss: DARP returned +4.55% in the first quarter, against a decline of -4.35% for the S&P 500 and -5.82% for the Nasdaq 100. This reflects the fund’s core thesis in practice: disruption at a reasonable price is not just a strategy for capturing upside, it carries inherent downside mitigation. Valuation discipline shows up not only in entry points but in the depth of the drawdown.
Vigilance in a Maturing Cycle
Our view remains that artificial intelligence represents a structural productivity shift, a disruption on a scale we believe exceeds anything the market has seen in the last thirty years. We are watching the capex figures behind this cycle closely, and they are, by any measure, large. But the figure that matters more to our conviction isn’t the capex itself, it’s the penetration of that spend into actual corporate deployment.
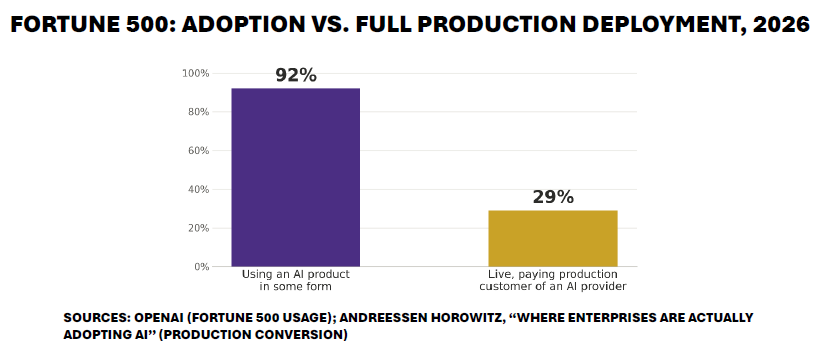
By our read, corporate America is still in the early stages of putting AI to work. Adoption is no longer in question - the vast majority of large companies (92%) now use an AI product in some form, and that figure feels intuitively right to anyone inside a modern organization.
But usage and deployment are two very different things. Andreessen Horowitz, found that only 29% of the Fortune 500 have converted to live, paying production customers of a leading AI provider — a real conversion from pilot to deployment, not simply a license or a trial. That gap, between near-universal experimentation and still-modest production use, is where we expect the next several years of this cycle to play out, and it remains wide.
That view is precisely why we believe now is the time to be more disciplined on valuation, not less. Our core holdings remain, in our judgment, firmly within the DARP (disruption at a reasonable price) framework. But certain corners of the AI market are showing signs of real froth — areas where near-term bottlenecks have attracted fast-moving capital chasing momentum. The neocloud sector is the clearest example. Names like CoreWeave and Nebius have traded at extreme multiples this year despite operating what is, in substance, a commodity business, reselling GPU capacity with little defensible intellectual property behind it. We have not owned either name.
The risk in that corner of the market was on full display at the start of the third quarter. Meta announced plans to sell its own excess AI compute capacity to third parties — a direct move into the neocloud business. Both CoreWeave and Nebius fell sharply on the news, reflecting a straightforward structural vulnerability: Meta is one of the largest customers for each company, and a customer that becomes a competitor is a different risk altogether. Setting aside what this signals about Meta’s own strategy for now, the lesson for allocators of capital is clear — this is what happens when a business model is priced for perfection at exactly the moment its customer base has both the means and the incentive to compete with it.
We’ll return to this theme in the next section, on the pitches we choose not to take. But the core message here bears repeating: valuation discipline doesn’t limit participation in disruption — it’s what allows us to stay invested in disruptive themes even when volatility spikes. The first half of this year illustrated both halves of that equation. As this cycle continues to play out, we believe protecting against overpaying for growth remains the single most effective thing an investor can do to stay exposed to the theme.
The Discipline of What We Don’t Own
Where we see froth is one side of valuation discipline. The other is knowing when to walk away entirely. Conviction in the names a fund holds is straightforward to articulate. Conviction expressed through the names it walks away from matters just as much, and SpaceX is the clearest example this year — a useful illustration of how we think about disruptive investing more broadly.
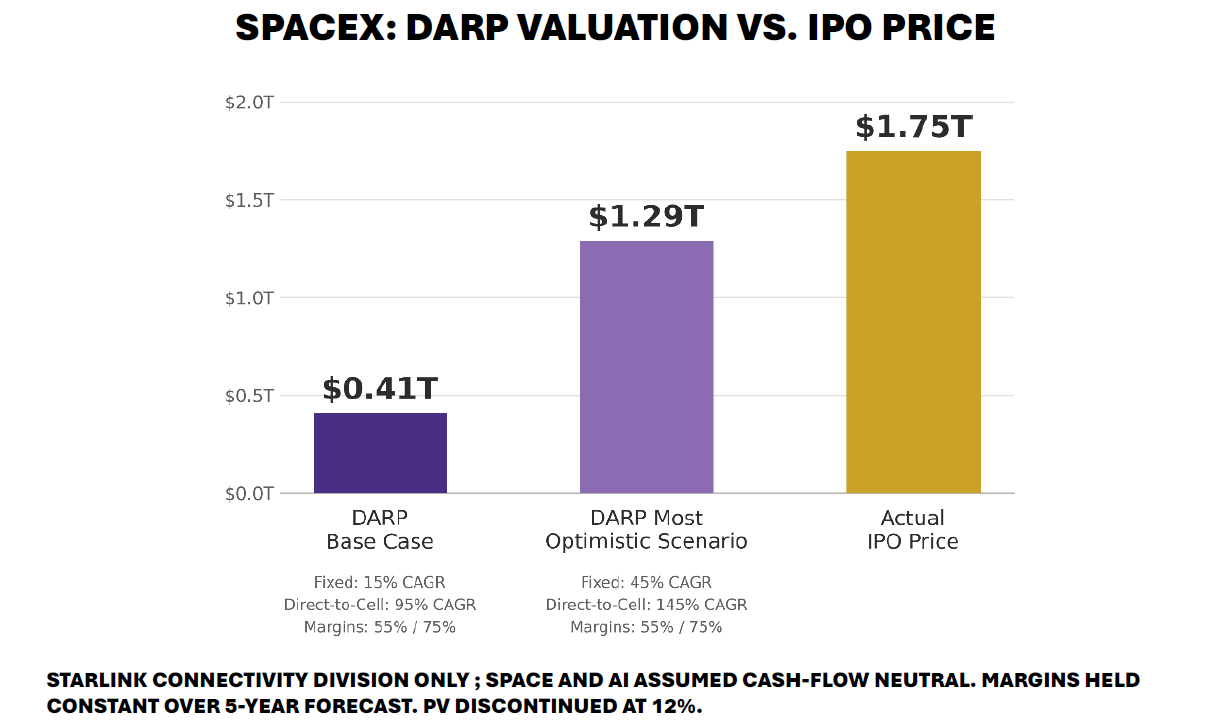
Our approach starts with the same question we ask of every name in this fund: can the business as a whole reach cash flow inflection within our four-to-six-year window SpaceX warranted a different lens (Grizzle SpaceX Deep Dive - May 29th, 2026). Given how much was already priced in, we thought it was worth isolating the pieces of the business we believe genuinely have a shot at that inflection — in this case, Starlink’s connectivity business — while holding the rest, Space and AI, at cash flow neutrality (a generous assumption on our part). Only then did we apply our base case and most optimistic assumptions to the piece of the business we think can actually get there, and check the result against the price being paid.
The numbers didn’t support the price. Valuing Starlink’s connectivity business alone under our base case assumptions produced a valuation of $0.41 trillion, roughly a quarter of where the company ultimately priced. Applying that same framework at its most optimistic plausible extreme still only reached $1.29 trillion, against an IPO price of $1.75 trillion. Even granting SpaceX the benefit of the doubt on two entire divisions of its business, the price still didn’t clear the bar. That combination — a base case for the business as a whole, narrowed down to the piece that can realistically inflect within our window, then checked against the price — is a hallmark of how we underwrite everything in this fund, owned or not.
An Artificial Intelligence Research Update: Token Supply and Demand
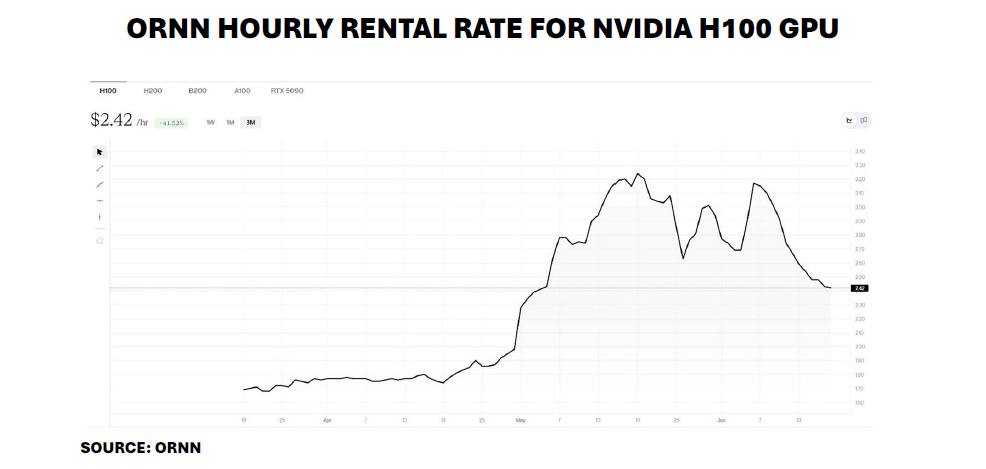
That same discipline extends beyond individual names to the AI theme as a whole. One question we’ve fielded often this year: is AI demand itself starting to soften? A widely watched index of GPU rental prices — the Ornn Compute H100 Price Index — declined roughly 30% over the first half of the year from its 2026 peak, and some have read that as an early sign of exactly that. Given how central this debate is to the AI investment case, we wanted to lay out what the underlying data actually shows.
Token Pricing
Compute pricing for generating tokens fell roughly 40% from its peak over the period, according to Ornn, a token rental data provider. We read this primarily as a demand side rotation rather than a demand-side weakening: users are shifting from expensive frontier models toward cheaper, still-capable open source alternatives from China and North America. Frontier model providers accounted for only 33% of tokens transacted on OpenRouter by the end of the first half, down from 55% at the start of the year, according to Exponential View.
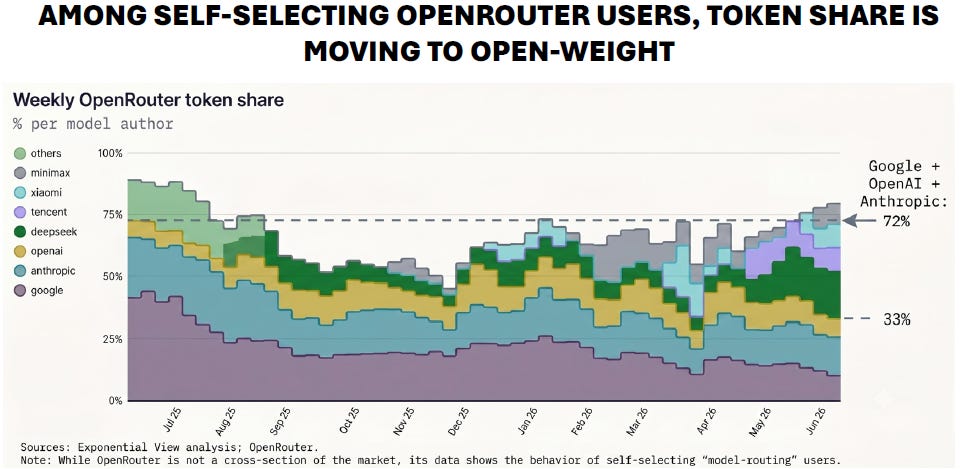
This is rational economic behavior, and in our view signals that AI spend among major users is maturing and becoming more efficient — a healthy sign for the market’s durability, not a warning sign of a demand reversal.
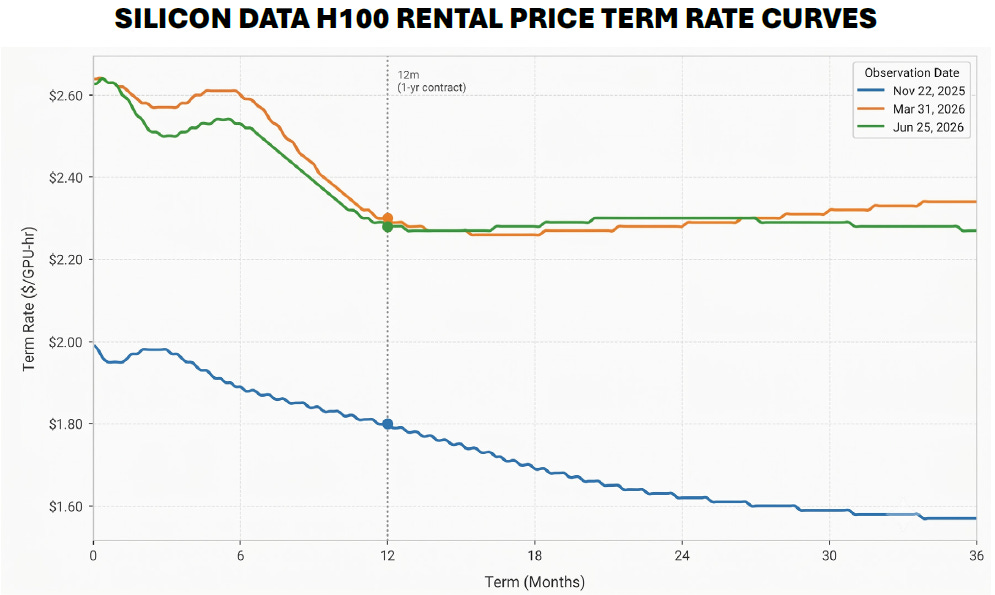
Zooming out, pricing continues to point to a market that remains compute constrained rather than oversupplied. The older Nvidia H100 GPU, released in 2022, rented for $2.25/hr by the end of the first half, up from $1.80/hr in November of last year, with pricing along the rental curve essentially unchanged since March. Rising rental prices for an increasingly obsolete GPU is not the signature of an oversupplied market. Even with rates off their recent highs, they remain up substantially versus year-ago levels.
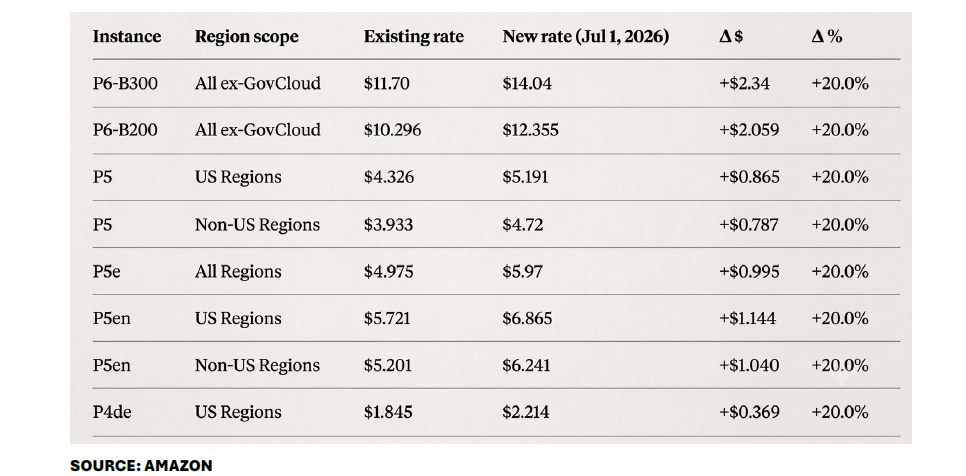
This reading was reinforced by Amazon’s decision, late in the second quarter, to raise token pricing across its family of GPU and ASIC instances — a move that is hard to square with any narrative of token oversupply.
Token Demand
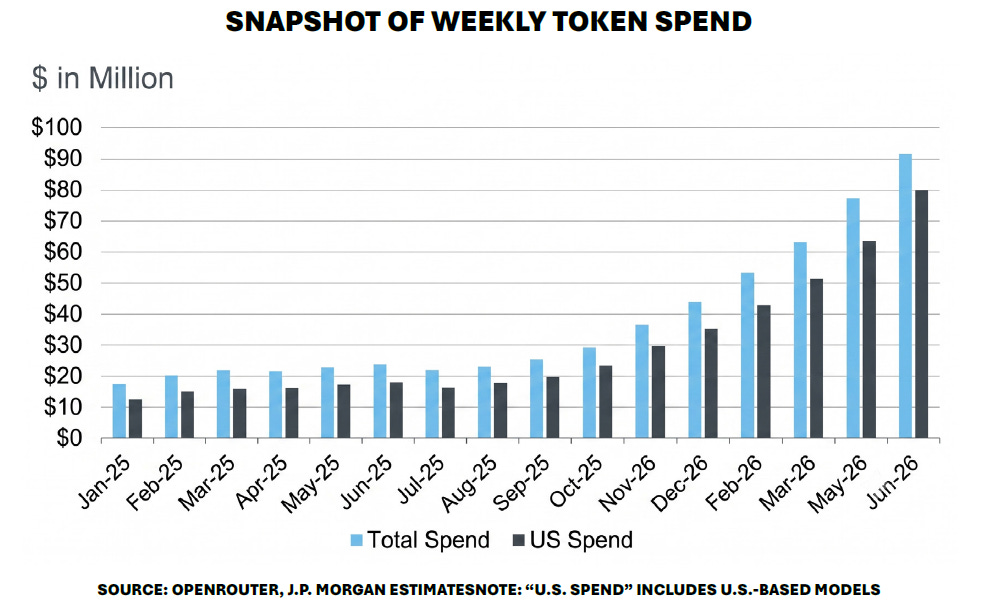
On the demand side, the data continues to show effectively insatiable appetite for tokens. JP Morgan’s global token output tracker, updated through period-end, showed output growing 70% month-over-month and reaching a new all-time high. We see no evidence of demand weakness in the data.
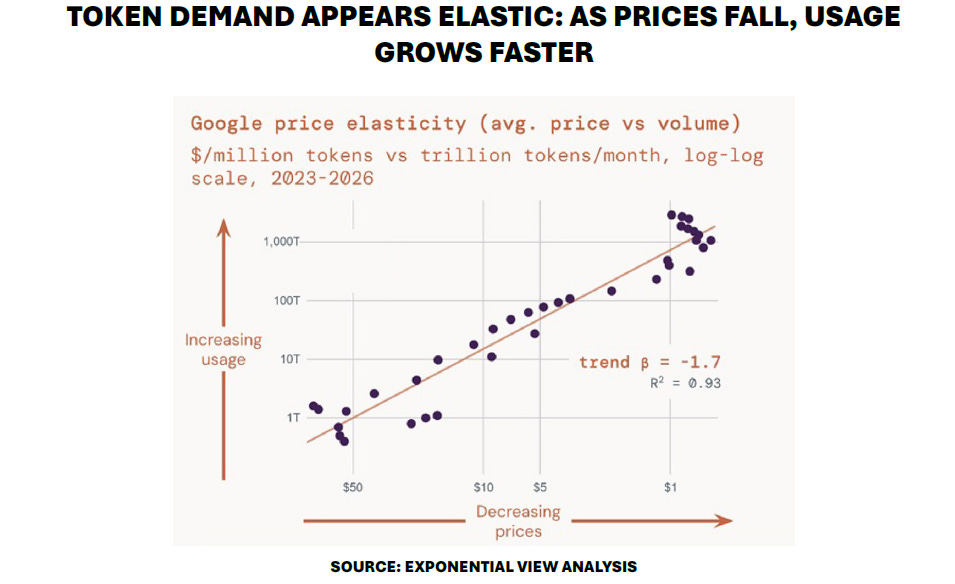
Taken together, the picture is consistent with a phenomenon economists call Jevons’ Paradox: as token prices fall, the market simply consumes more of them, such that total spend continues to rise even as unit prices decline. Google’s own token pricing versus usage over the past three years bears this out clearly — falling prices have consistently driven rising usage, not falling revenue.
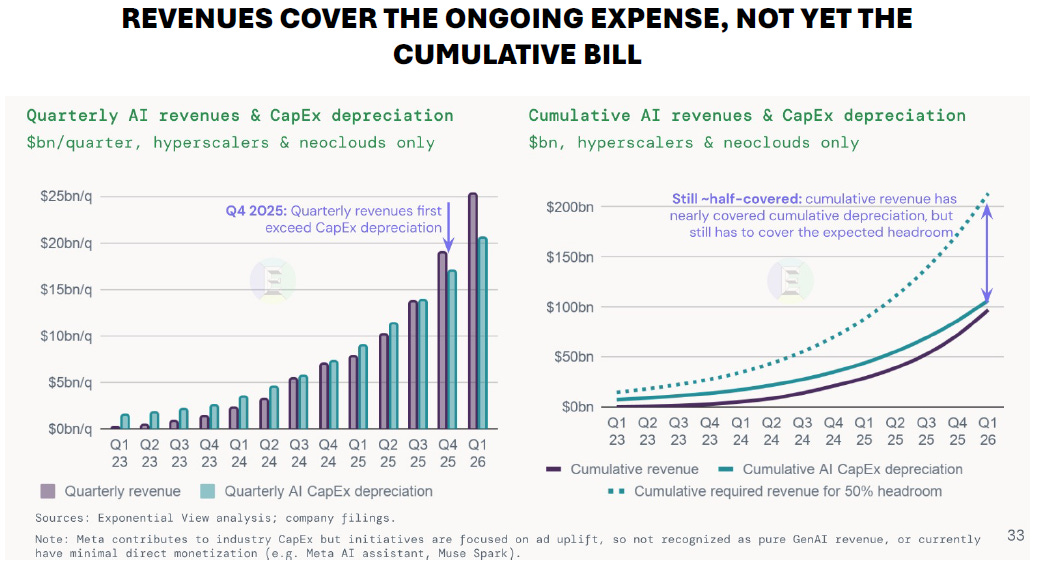
This dynamic has, so far, kept revenue growth across the AI industry running well ahead of the decline in unit economics. According to the emerging technology research consultancy Exponential View, quarterly AI industry revenue has now exceeded depreciation for six consecutive months — a threshold that matters because depreciation is the real economic cost of the industry’s record capital spending.
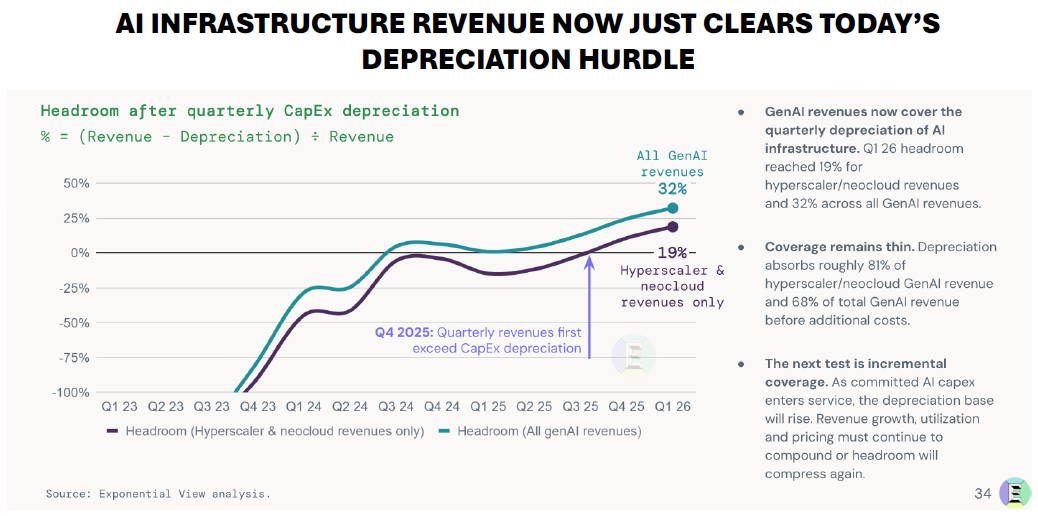
The market’s central concern about the AI buildout — whether the return on capex will ultimately justify the investment — will continue to ease as long as revenue growth outpaces depreciation. Exponential View currently estimates AI revenue exceeds depreciation by 32%, a positive but still-early signal; we believe that figure needs to reach roughly 50% for the industry to generate durable, attractive long-term margins. Getting there will require some combination of continued pricing power and rising utilization, both of which the data currently supports.
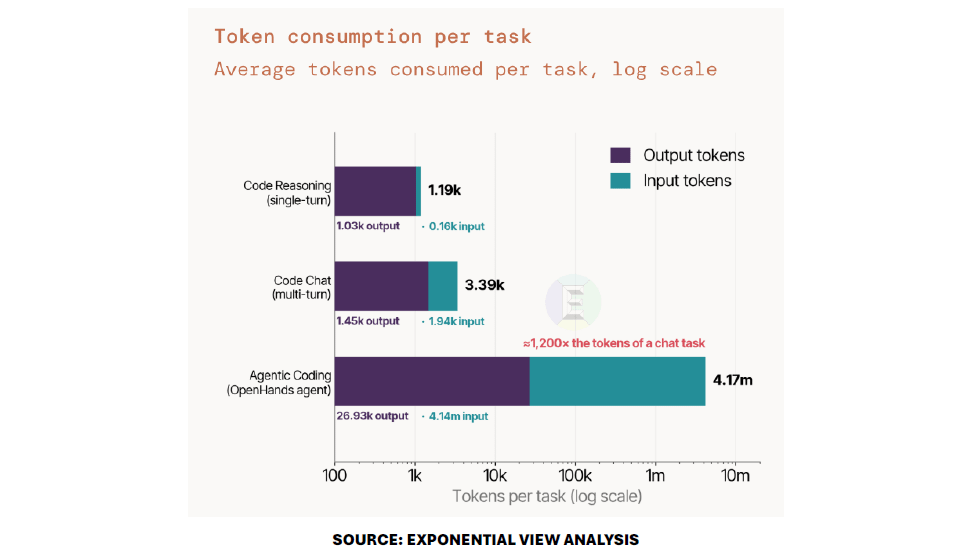
Taken as a whole, the evidence points to an industry that remains effectively sold out of AI tokens: falling rental prices are being met almost immediately with rising usage, which continues to push aggregate revenue higher. We experience this directly. As heavy users of AI tools ourselves, Grizzle now regularly exhausts token capacity on both Claude and OpenAI under our fixed-price plans — something that was not happening even one quarter ago. We expect the continued explosion in tokens consumed per task, driven in large part by the rise of agentic coding, to remain a key catalyst for well-positioned AI infrastructure names going forward.
Store of Wealth: A Diverging Path for Gold and Bitcoin
Shifting from the AI complex to the other side of our thematic exposure — hard money. In our year-end letter, we flagged a shift underway in this space: a rotation of conviction towards gold and silver and away from Bitcoin. That dynamic has continued to play out. Year-to-date through June 30, gold is down 7%, while Bitcoin is down 33%, a meaningful divergence between two assets viewed as “store of value”.
We think the difference lies less in what each asset is than in who owns it. Bitcoin’s original holder base was built on long-duration conviction — investors who held through volatility because they viewed the asset as structurally different from a trade, a discipline captured in the term “HODL” (hold on for dear life) The largest tranche of capital to enter Bitcoin over the past two years, however, has arrived through ETFs, and that capital doesn’t carry the same conviction.
The behavior of iShares Bitcoin Unit Trust ETF (IBIT) unit count illustrates this well. Through most of 2025, unit counts held steady even as Bitcoin came under initial pressure — the ETF holder base didn’t budge. That changed in May 2026, when units began falling sharply. Rather than following Bitcoin’s price lower, that outflow appears to have triggered it.
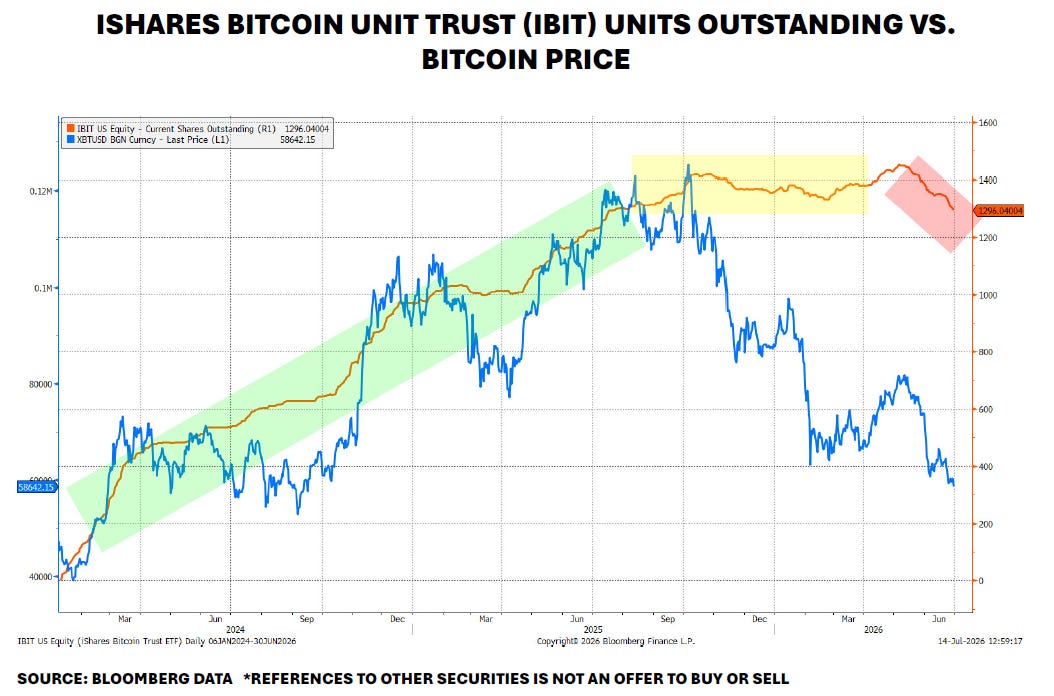
This tells us something about the character of the capital: durable enough to absorb a quarter of drawdown, not durable enough to hold through sustained pressure. It is not fully sticky money. The flip side is that this capital, having exited, is now sidelined and defensive — effectively scared money, unlikely to rotate back in quickly.
Our expectation is that this capital continues to migrate toward gold, and specifically toward gold equities, which offer leveraged exposure to the store-of-wealth trade rather than the metal itself. These rotations tend to move first through the largest, most liquid names before cascading into mid- and small-cap producers. Consistent with that view, we re-established a position in Kinross Gold late in the quarter.
Thank you for your continued confidence in DARP.
Thomas George, CFA and Scott Willis, CFA
Portfolio Managers, Grizzle Growth ETF
DISCLOSURES
Shares of the Grizzle Growth ETF may be bought or sold throughout the day at their market price on the exchange on which they are listed. The market price of the Grizzle Growth ETF shares may be at, above or below the fund’s net asset value (“NAV”) and will fluctuate with changes in the NAV as well as supply and demand in the market for the shares. The market price of the fund’s shares may differ significantly from their NAV during periods of market volatility. Investors cannot invest directly in indices or averages, and their performance does not reflect fees and expenses or represent the performance of the Grizzle Growth ETF.
Price/Earnings: The trailing price/earnings ratio measures value by dividing a stock’s most recent price by the previous year’s earnings per share.
EPS Growth: The forecast growth rate of earnings per shares
The price/book (P/B) ratio measures a company’s stock price compared with its book value. The ratio is calculated by taking the market price per share of an investment and dividing it by the book value per share.
Price/Cashflow: The price/cash flow ratio calculates value by dividing a stock’s current price by the company’s free cash flow over the trailing 12 months.
Long Term Earnings Growth (%): The long-term projected earnings growth rate for a stock is the average of the available third-party analysts estimates for three- to five-year EPS growth.
PEG Ratio: is a stock valuation metric that relates a company’s stock price to its expected earnings per share growth rate. P/E divided by expected growth rate. Cashflow: Cashflow from operations. Comes from the statement of cashflow.
NAV: Net Asset Value (NAV) represents the per-share market value of a fund—such as a mutual fund or ETF—calculated by subtracting total liabilities from total assets and dividing by outstanding shares. Updated daily, it helps investors determine the fair value of their holdings.
Market Price: Market price is the price of an asset that a willing buyer pays to acquire the asset from a willing seller, when a buyer and seller are independent.
Investing involves risk. Principal loss is possible.
Growth Investing Risk. Growth stocks can be volatile for several reasons. Since those companies usually invest a high portion of earnings in their businesses, they may lack the dividends of value stocks that can cushion stock prices in a falling market.
Foreign Securities Risk. Investments in securities or other instruments of non-U.S. issuers involve certain risks not involved in domestic investments and may experience more rapid and extreme changes in value than investments in securities of U.S. companies.
Derivatives Risk. Derivatives are financial instruments that derive value from the underlying reference asset or assets, such as stocks, bonds, commodities, currencies, funds (including ETFs), interest rates or indexes.
Options Risk. The prices of options may change rapidly over time and do not necessarily move in tandem with the price of the underlying securities. Selling call options reduces the Fund’s ability to profit from increases in the value of the Fund’s equity portfolio, and purchasing put options may result in the Fund’s loss of premiums paid in the event that the put options expire unexercised.
Emerging Markets Risk. The Fund may invest indirectly, via ADRs, in securities issued by companies domiciled or headquartered in emerging market nations.
High Portfolio Turnover Risk. The Fund may actively and frequently trade all or a significant portion of the securities in its portfolio. A high portfolio turnover rate increases transaction costs, which may increase the Fund’s expenses.
Models and Data Risk. When Models and Data prove to be incorrect or incomplete, any decisions made in reliance thereon expose the Fund to potential risks.
NASDAQ-100 Index: A globally recognized index of 100 of the most innovative large cap companies listed on the Nasdaq Stock Market
The Morningstar RatingTM (“star rating”) is calculated for funds with at least a three-year history. Exchange-traded and open-end mutual funds are combined into a single population for comparative purposes. It is calculated based on a Morningstar Risk-Adjusted Return measure that accounts for variation in a fund’s monthly excess performance, placing more emphasis on downward variations and rewarding consistent performance. The top 10% of funds in each fund category receive 5 stars, the next 22.5% receive 4 stars, the next 35% receive 3 stars, the next 22.5% receive 2 stars, and the bottom 10% receive 1 star. The Overall Morningstar RatingTM is a weighted average of the performance figures associated with a fund’s 3-, 5-, and 10-year (if applicable) Morningstar RatingTM metrics. Morningstar rankings are based on a fund’s average annual total return relative to all funds in the same Morningstar category. Fund performance used within the rankings, reflects certain fee waivers, without which, returns and Morningstar rankings would have been lower. The highest (or most favorable) percentile rank is 1 and the lowest (or least favorable) percentile rank is 100.
Overall Morningstar Rating based on risk adjusted return in the US Fund Lg Growth category out of 1,002 funds as of 1/31/2026
Investors should consider the investment objectives, risks, charges, and expenses carefully before investing. For a prospectus or summary prospectus with this and other information about the Fund, please call (267) 419-7469 or visit our website at www.etf.grizzle.com. Read the prospectus or summary prospectus carefully before investing.
Distributed by Foreside Fund Services LLC.