
Grizzle Growth ETF Year-End Letter: Performance & 2026 Outlook

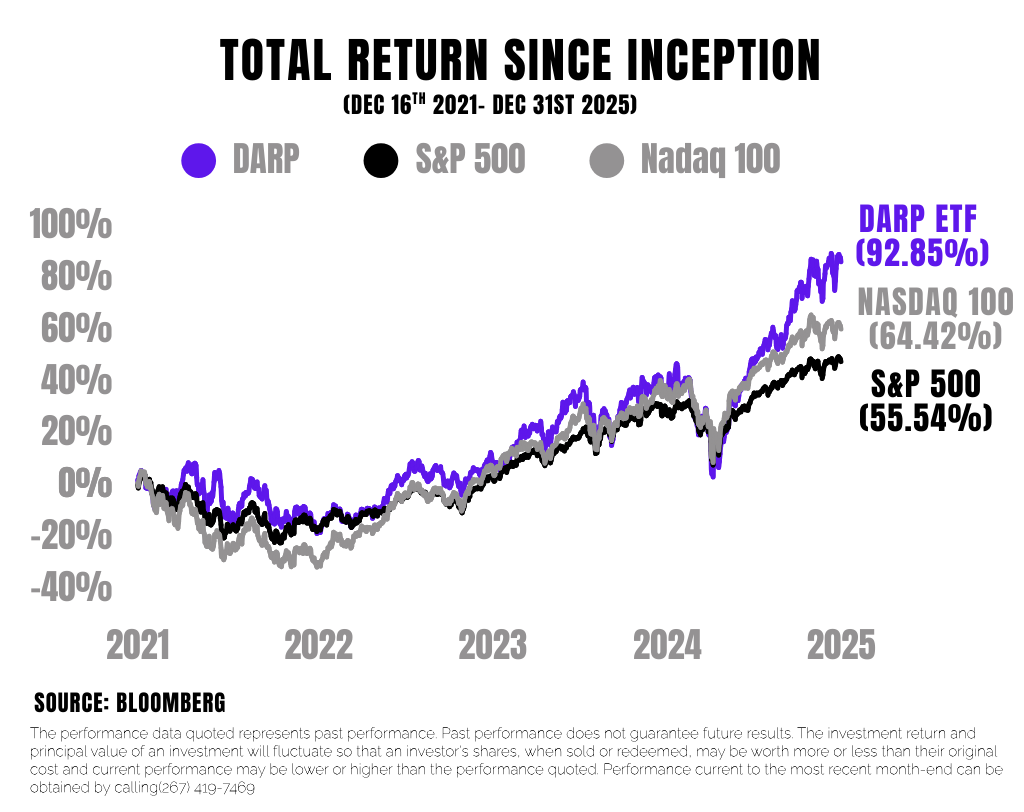
The Grizzle Growth ETF (NYSE:DARP) returned 40.11% in 2025 vs 17.86% for the S&P 500, placing our fund in the 1st Percentile as of 1/31/2026 in the US Fund Large Growth Category out of 1002 funds, by Morningstar for the one-year period based on total return.
*For standardized performance click HERE
Our year-end letter breaks down the AI infrastructure thesis, commodity supercycle positioning, and 2026 outlook.
Read our full 2025 Year-End Review ➡️ LINK
5-Star Morningstar Rating*, 1st Percentile Performance
Since inception on December 16, 2021, DARP has delivered a cumulative return of 92.85% vs 55.54% for the S&P 500—outperformance of 37+ percentage points in just four years.
This performance earned us a 5-star Morningstar rating and places the fund in the top 1% of US Large Cap Growth funds for 2025.
*Morningstar Star Rating based on risk adjusted return in the US Fund Lg Growth category out of 1,002 funds. Returns are on a 3-year basis as of 1/31/2026. Morningstar Rankings represent a fund’s total-return percentile rank relative to all funds that have the same Morningstar Category. The highest percentile rank is 1 and the lowest is 100. It is based on Morningstar total return, which includes both income and capital gains or losses and is not adjusted for sales charges or redemption fees. For 2022, the fund ranked in the 10th Percentile out of 1,235 funds; in 2023 the fund ranked in the 64th percentile out of 1,200 funds; and in 2024 the fund ranked in the 74th percentile out of 1,088 funds in the US Fund Large Growth Category. Past performance does not guarantee future results.
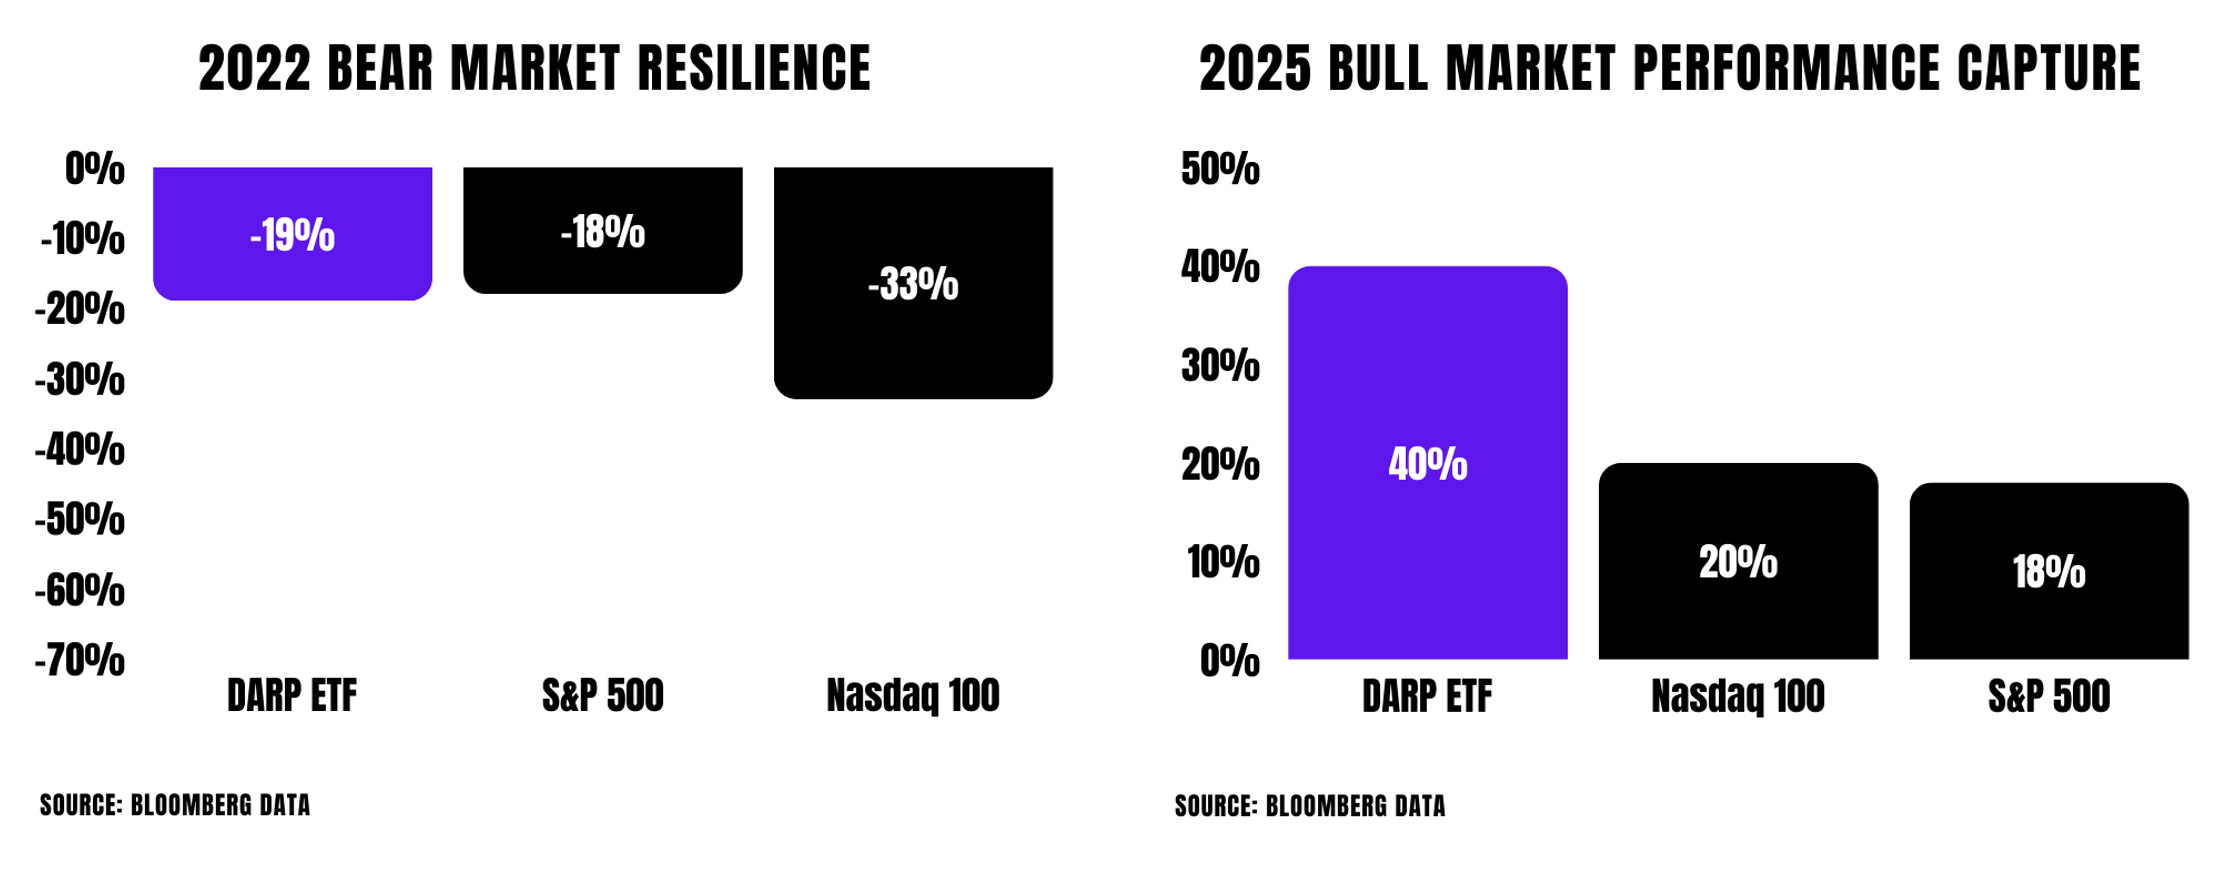
All-Weather Performance: Bear Markets & Bull Markets
DARP's strategic allocation to commodity equities—often viewed as contrarian in a "disruptive growth" fund—has proven its value across divergent market environments:
2022 Bear Market: While the Nasdaq 100 fell -31% DARP’s drawdown was limited to -20% (matching the S&P 500). Our commodity allocation delivered a +10% contribution when technology stocks cratered.
2025 Bull Market: In a year favoring disruptive growth, DARP captured the full upside with a 40% return, outperforming the Nasdaq 100 (20%) and peers. Commodities remained a meaningful contributor (+5%), demonstrating that energy and materials aren’t just defensive ballast—they’re critical to the AI infrastructure build-out.
Growth at a Discount: The PEG Ratio Advantage
After rigorous bottom-up analysis of our portfolio, we’re pleased to confirm that DARP continues to offer exponential growth at a structural discount to the market.
Our forward PEG ratio is 0.25x vs 0.72x for the S&P 500. This means we’re buying 106% projected earnings growth (vs 35% for the benchmark) at valuations that don’t fully price in that growth potential. The gap has actually widened in 2025 despite our strong performance.
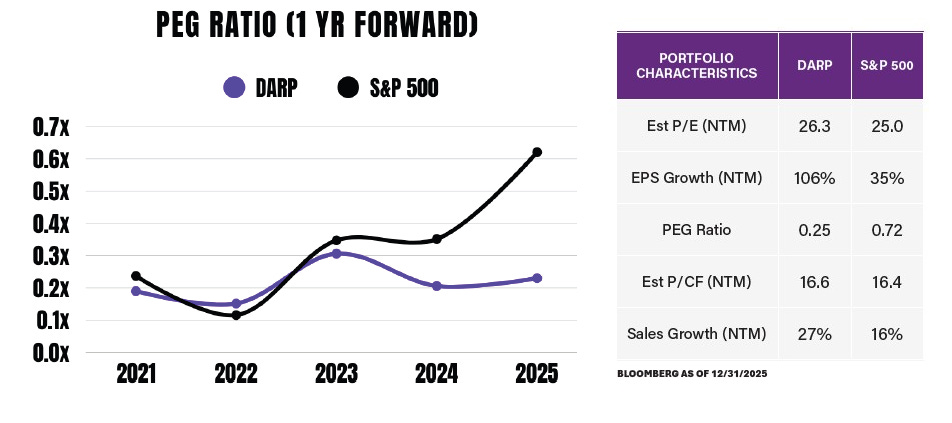
In our view, our PEG ratio demonstrates the fund’s avoidance of growth at any price in favor of disruption at a reasonable price.
What’s Ahead for 2026
Our year-end letter outlines three high-conviction themes for 2026:
The Industrialization of AI – Value capture shifts from GPU (graphics processing units) to data center infrastructure (power, networking, thermal management)
The Commodity Supercycle – Natural gas, uranium, and copper underpin the AI build-out
The Hard Money Pivot – Rotating from Bitcoin to Gold/Silver miners as risk premiums shift*
*The Fund does not invest directly in Bitcoin, gold/gold bullion, or silver/silver bullion.
We also address our primary risk monitor: the shift toward debt financing in AI infrastructure and what it means for 2026.
Read our full 2025 Year-End Review here ➡️ LINK
Thank you for your continued confidence in DARP.
Thomas George, CFA and Scott Willis, CFA
Portfolio Managers, Grizzle Growth ETF
DISCLOSURES
Shares of the Grizzle Growth ETF may be bought or sold throughout the day at their market price on the exchange on which they are listed. The market price of the Grizzle Growth ETF shares may be at, above or below the fund’s net asset value (“NAV”) and will fluctuate with changes in the NAV as well as supply and demand in the market for the shares. The market price of the fund’s shares may differ significantly from their NAV during periods of market volatility. Investors cannot invest directly in indices or averages, and their performance does not reflect fees and expenses or represent the performance of the Grizzle Growth ETF.
Price/Earnings: The trailing price/earnings ratio measures value by dividing a stock’s most recent price by the previous year’s earnings per share.
EPS Growth: The forecast growth rate of earnings per shares
The price/book (P/B) ratio measures a company’s stock price compared with its book value. The ratio is calculated by taking the market price per share of an investment and dividing it by the book value per share.
Price/Cashflow: The price/cash flow ratio calculates value by dividing a stock’s current price by the company’s free cash flow over the trailing 12 months.
Long Term Earnings Growth (%): The long-term projected earnings growth rate for a stock is the average of the available third-party analysts estimates for three- to five-year EPS growth.
PEG Ratio: is a stock valuation metric that relates a company’s stock price to its expected earnings per share growth rate. P/E divided by expected growth rate. Cashflow: Cashflow from operations. Comes from the statement of cashflow.
NAV: Net Asset Value (NAV) represents the per-share market value of a fund—such as a mutual fund or ETF—calculated by subtracting total liabilities from total assets and dividing by outstanding shares. Updated daily, it helps investors determine the fair value of their holdings.
Market Price: Market price is the price of an asset that a willing buyer pays to acquire the asset from a willing seller, when a buyer and seller are independent.
Investing involves risk. Principal loss is possible.
Growth Investing Risk. Growth stocks can be volatile for several reasons. Since those companies usually invest a high portion of earnings in their businesses, they may lack the dividends of value stocks that can cushion stock prices in a falling market.
Foreign Securities Risk. Investments in securities or other instruments of non-U.S. issuers involve certain risks not involved in domestic investments and may experience more rapid and extreme changes in value than investments in securities of U.S. companies.
Derivatives Risk. Derivatives are financial instruments that derive value from the underlying reference asset or assets, such as stocks, bonds, commodities, currencies, funds (including ETFs), interest rates or indexes.
Options Risk. The prices of options may change rapidly over time and do not necessarily move in tandem with the price of the underlying securities. Selling call options reduces the Fund’s ability to profit from increases in the value of the Fund’s equity portfolio, and purchasing put options may result in the Fund’s loss of premiums paid in the event that the put options expire unexercised.
Emerging Markets Risk. The Fund may invest indirectly, via ADRs, in securities issued by companies domiciled or headquartered in emerging market nations.
High Portfolio Turnover Risk. The Fund may actively and frequently trade all or a significant portion of the securities in its portfolio. A high portfolio turnover rate increases transaction costs, which may increase the Fund’s expenses.
Models and Data Risk. When Models and Data prove to be incorrect or incomplete, any decisions made in reliance thereon expose the Fund to potential risks.
NASDAQ-100 Index: A globally recognized index of 100 of the most innovative large cap companies listed on the Nasdaq Stock Market
The Morningstar RatingTM (“star rating”) is calculated for funds with at least a three-year history. Exchange-traded and open-end mutual funds are combined into a single population for comparative purposes. It is calculated based on a Morningstar Risk-Adjusted Return measure that accounts for variation in a fund’s monthly excess performance, placing more emphasis on downward variations and rewarding consistent performance. The top 10% of funds in each fund category receive 5 stars, the next 22.5% receive 4 stars, the next 35% receive 3 stars, the next 22.5% receive 2 stars, and the bottom 10% receive 1 star. The Overall Morningstar RatingTM is a weighted average of the performance figures associated with a fund’s 3-, 5-, and 10-year (if applicable) Morningstar RatingTM metrics. Morningstar rankings are based on a fund’s average annual total return relative to all funds in the same Morningstar category. Fund performance used within the rankings, reflects certain fee waivers, without which, returns and Morningstar rankings would have been lower. The highest (or most favorable) percentile rank is 1 and the lowest (or least favorable) percentile rank is 100.
Overall Morningstar Rating based on risk adjusted return in the US Fund Lg Growth category out of 1,002 funds as of 1/31/2026
Investors should consider the investment objectives, risks, charges, and expenses carefully before investing. For a prospectus or summary prospectus with this and other information about the Fund, please call (267) 419-7469 or visit our website at www.etf.grizzle.com. Read the prospectus or summary prospectus carefully before investing.
Distributed by Foreside Fund Services LLC.