Are Gold Prices Being Manipulated?
Soaring gold is not in the interest of the relevant authorities any more than surging oil prices.
Author: Chris Wood
An old contact told this writer recently of something he was not aware of.
That is that former Federal Reserve chairman Paul Volcker once said that the one mistake he had made in the late 1970s was not stopping the price of gold from rising as much it did in that period when the American central bank was engaged in fighting inflation.
Back then gold rose from US$220/oz in January 1979 to a peak of US$850/oz in January 1980.
This was during the period when the Volcker Fed raised the federal funds rate from 10% in early 1979 to a peak of 20% in March 1980.
For the record, US CPI inflation peaked at 14.8% YoY in March 1980 while the ten-year Treasury bond yield peaked at 15.8% in September 1981.
Volcker’s observation, if true since it is not possible to find documented evidence of it, is interesting given the obvious temptation on the part of a major central bank to seek to try to manage the gold price.
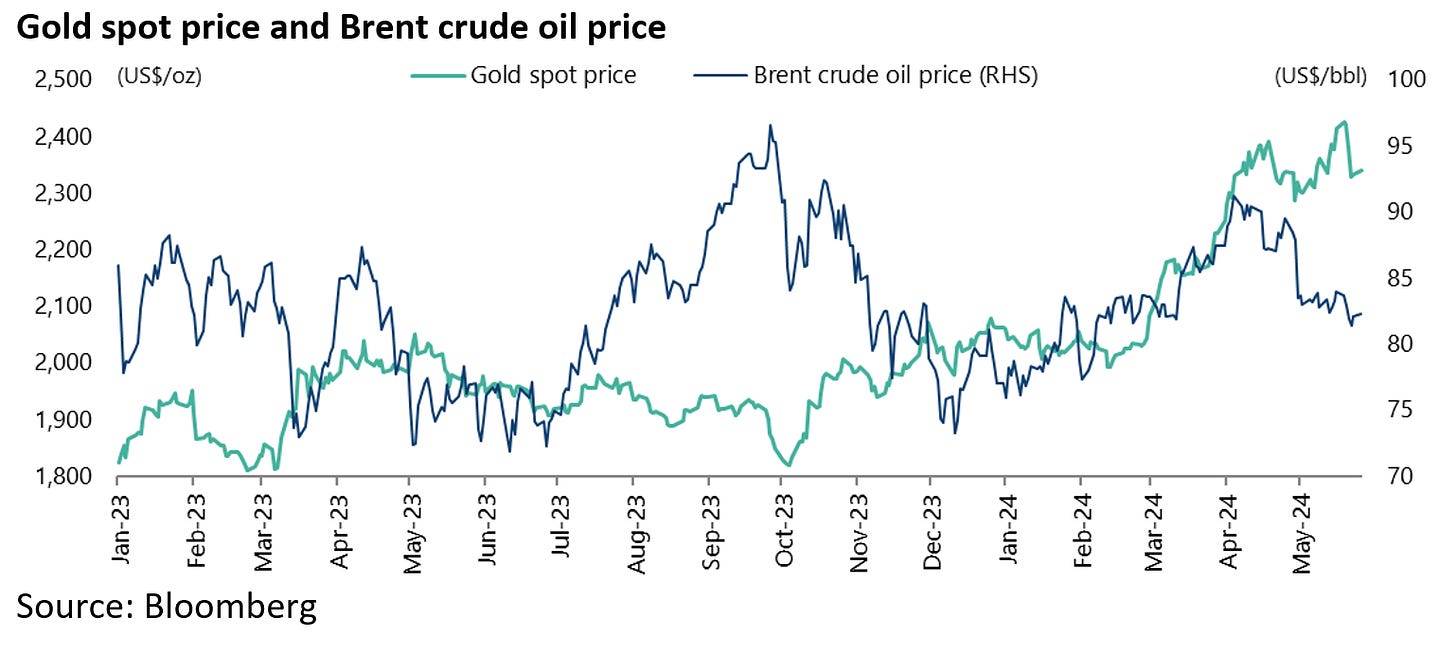
On that point, Comex trading records showed that at 3pm New York time on 4 April 2024 there was a US$1.6bn sale of gold futures in about three minutes which temporarily knocked the bullion spot price from US$2,306/oz to US$2,268/oz before it rebounded to US$2,330/oz on 5 April.
This writer has no idea of who or what was behind such a trade save to note that a soaring gold price is not in the interest of the relevant authorities any more than a surging oil price is.
Gold is up by 29% since early October and by 18% since mid-February, while the Brent crude oil price is up by 14% since mid-December.
The Underlying Drivers of the Current Gold Rally Aren't Straightforward
Meanwhile if the causes of the rebound in the oil price are reasonably self-evident, not least of which are the supply constraints still enforced by Opec Plus, the near-term drivers of the current gold rally are much less clear even to a long-term gold bull like this writer.
For now at least there continues to be a notable lack of inflows into gold ETFs in the Western world.
Rather the reverse is the case.
Gold ETFs’ holdings have declined by 152 tonnes year to date to 2,510 tonnes as of 24 May following a decline of 254 tonnes in 2023, according to Bloomberg.
It is also the case that the physical premium on gold bars and coins traded in Singapore are at only a normal 2% compared with the 7-8% levels seen at the peak of the last bull market in 2011 and 2012.
There is also no evidence of a sudden pickup in sales of American Eagle Bullion coins, one of the most popular series in the US.
Indeed American Eagle gold bullion coin sales declined from 23,000 oz in March to 19,500 oz in April, the lowest level for the month of April since 2019.
This compares with an average of 67,533 oz for the month of April since 2010.
It is also the case that, while gold mining stocks have rallied this year, they are not outperforming bullion on the scale which would normally be expected to happen in a roaring bull market, which is what happened in the 2001 to 2011 period.
Thus, the NYSE Arca Gold BUGS Index has risen by 38.9% since bottoming in late February and is up 13.5% year-to-date.
As a result, the gold mining index has outperformed gold bullion by 20.5% since late February but is still underperforming by 0.1% year-to-date.
By contrast, in the 2001-2011 period, gold bullion price rose by 644% from a closing low of US$256/oz in April 2001 to a closing high of US$1,900/oz in September 2011.
While the gold mining index was up 1,664% from the low in November 2000 to a peak in September 2011.
As a result, the index outperformed gold bullion by 203% in the period between November 2000 to April 2011.
Meanwhile, gold mining stocks remain extremely cheap based on the current bullion price.
The NYSE Arca Gold BUGS Index is trading at the same level as it was in December 2005 when the gold price was only around US$510/oz.
If all of the above shows a distinct lack of investor euphoria as regards gold, the question remains what is driving the current rally.
The most plausible explanation remains demand from China. Still there is a lack of concrete data to confirm such an explanation.
True, the PBOC has bought gold for 18 months in a row according to the official foreign reserves data.
China’s official gold reserves have increased by 316 tonnes or 16.2% from 1,948 tonnes at the end of October 2022 to 2,264 tonnes at the end of April 2024.
But there is a lack of hard data on retail demand for gold.
In this respect, the best anecdotal evidence has seen of late as regards retail investor interest in gold in China was a Bloomberg article published in April about the suspension of an ETF investing in gold shares after it reached a more than 30% premium over its underlying assets (see following chart and Bloomberg article: “China’s Latest Investment Frenzy Sparks Wild Swings in Gold ETF”, 8 April 2024).
It is also the case that China gold mining shares have of late outperformed their Western counterparts. Zijin Mining, for example, is up 64% from its low this year reached in late January, compared with a 23% rise in the NYSE Arca Gold BUGS Index over the same period.
Meanwhile, in terms of hard data, China’s imports of gold increased by 29% YoY to 702 tonnes in the first four months of 2024.
If all of the above is of interest, it is impressive that bullion has broken out to new highs without any corroborating evidence of ETF inflows in the Western world.
While this latter point clearly highlights that there is a risk to the current rally, as does the fact that net long gold speculative positions held by money managers such as hedge funds are up from 46,400 contracts in mid-February to 193,972 contracts in the week ended 21 May, probably the biggest risk remains official attempts to manage the price down.
Why Isn't Gold Even Higher with Massive G7 Gov't Deficits?
In this respect, the big picture issue is less why gold is rising now than why it has not risen by much more in recent years when G7 central banks in the quanto easing era have engaged in increasingly aggressive monetisation as reflected in the extraordinary expansion of their balance sheets.
For the record, the balance sheets of the Fed, the ECB and the Bank of Japan have risen from a combined US$5.5tn in March 2009 to a peak of US$25tn in February 2022 and are now US$19.3tn.
On this point, it should be remembered that when Ben Bernanke embarked on QE in late 2008 he was at pains to highlight it would only be a temporary move.
Fifteen years later and manipulation of the Fed balance sheet has become a core part of the Fed and other G7 central banks’ monetary policy in what could be described as the new orthodoxy.


Great Article, Sir.
https://open.substack.com/pub/campbellramble/p/gold-in-china?r=z0g3y&utm_medium=ios