AI Compute is Ramping, But is Demand There to Meet it?

Author: Chris Wood
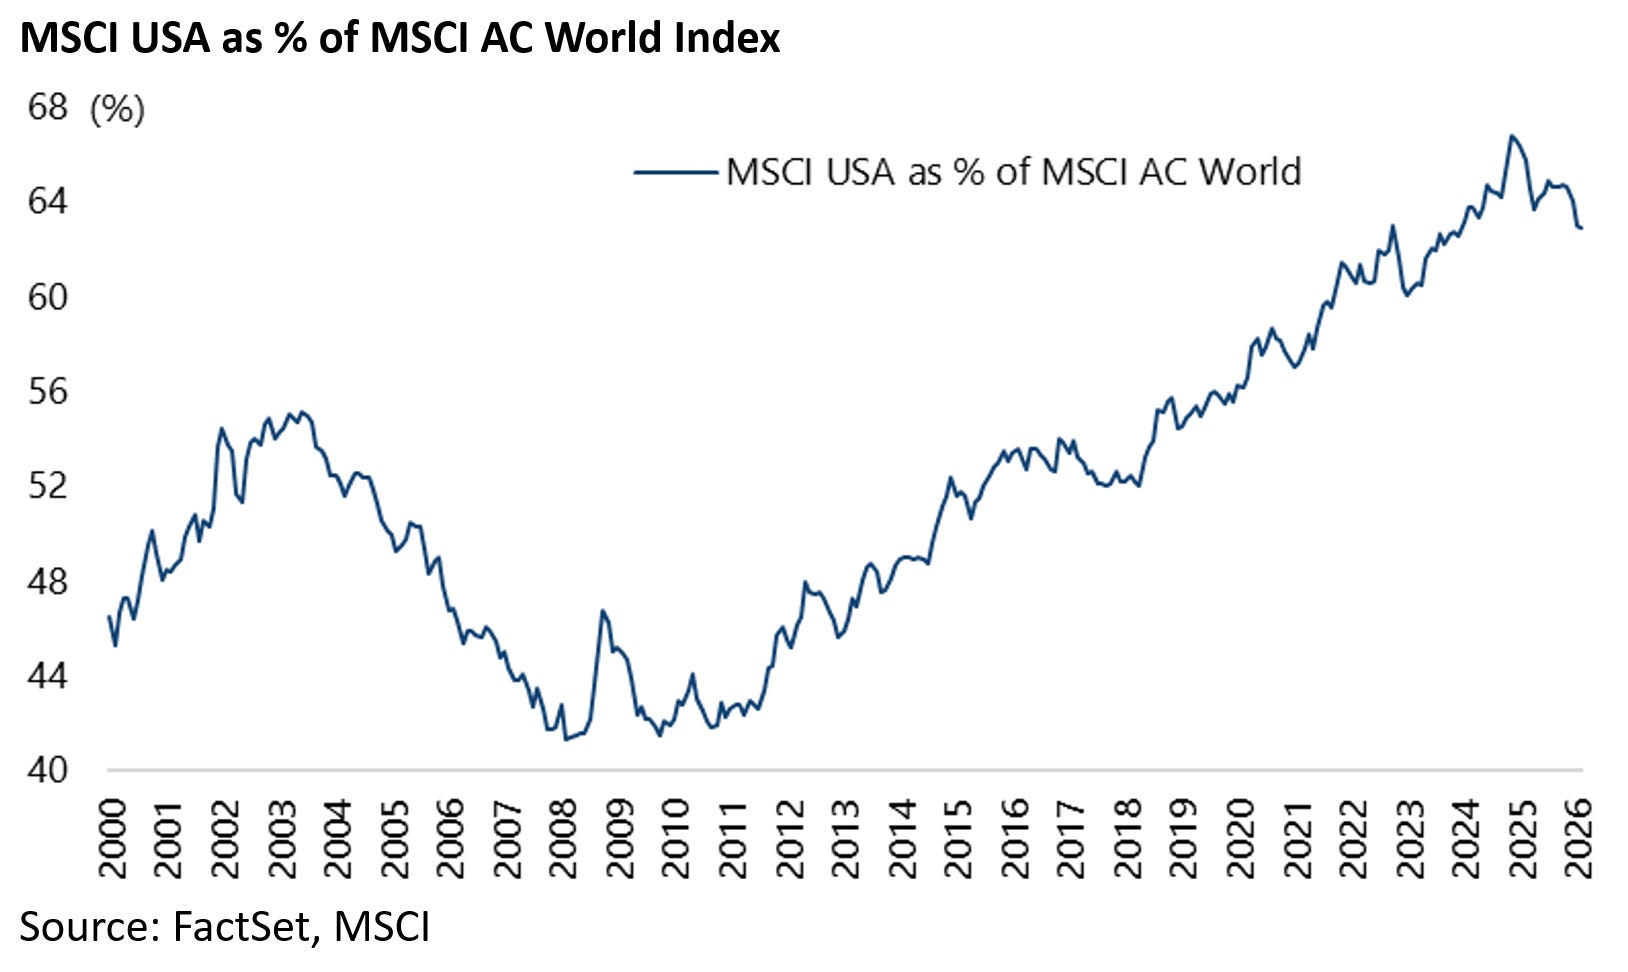
The base case remains that the US reached an all-time peak of world stock market capitalisation on 24 December 2024. America’s share of MSCI AC World Index l peaked at 67.2% and is now 62.9%.
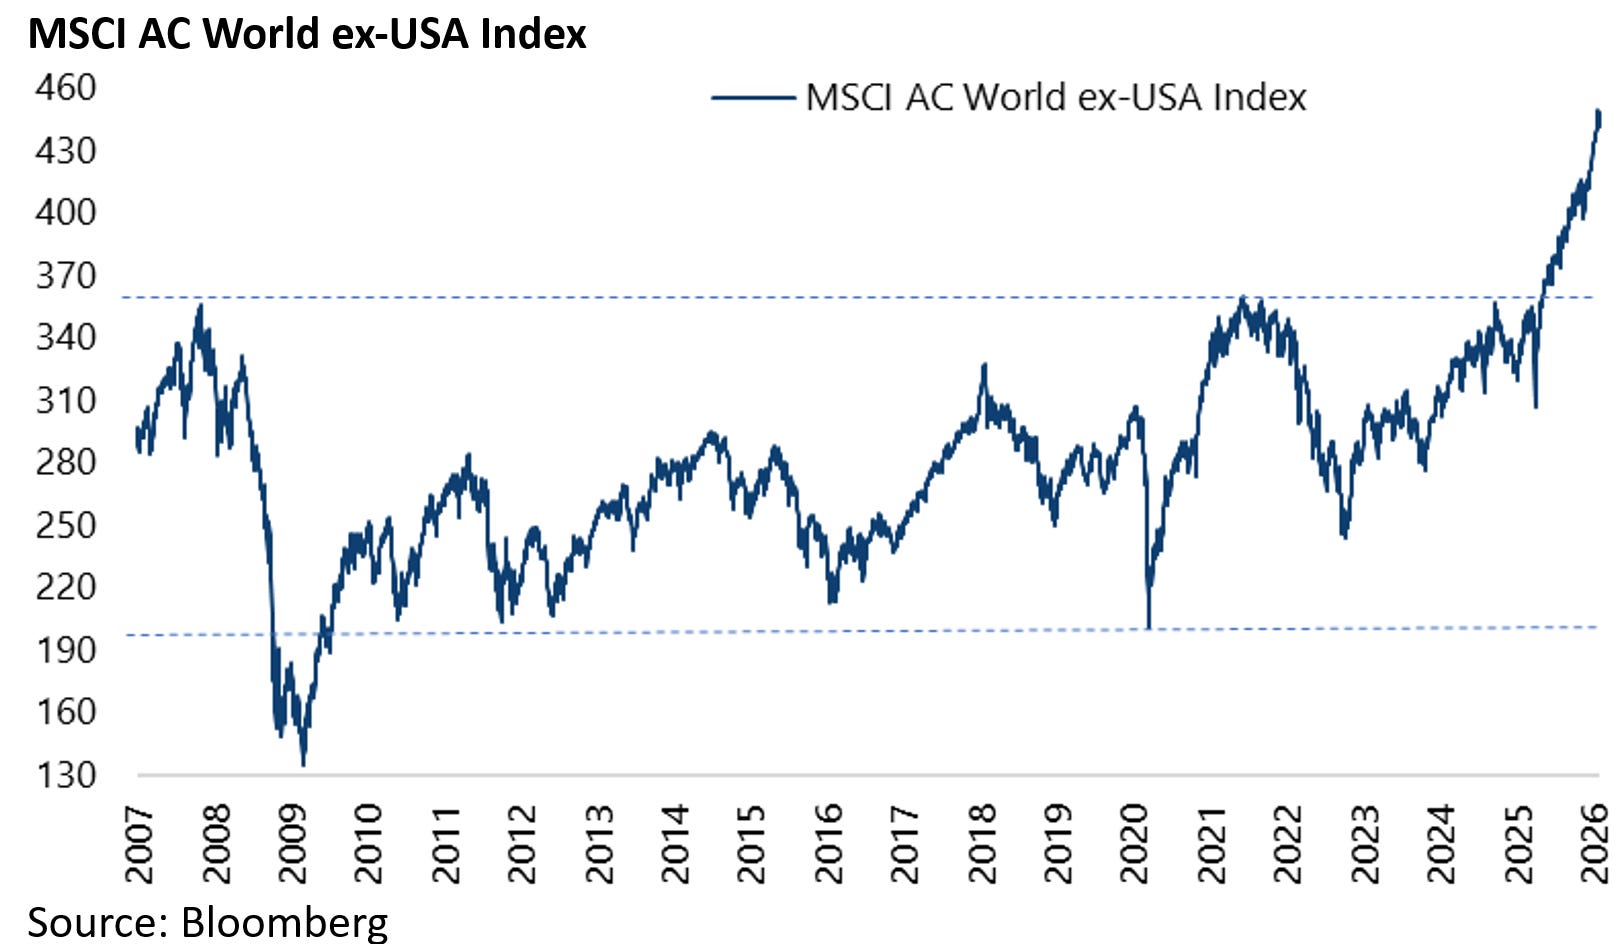
Meanwhile the MSCI AC World ex-US Index broke out of a 18-year trading range last year supporting such a view.
The index has risen by 46% from the recent low reached in early April 2025 to 445.7, after reaching a record high of 452.6 on 28 January.
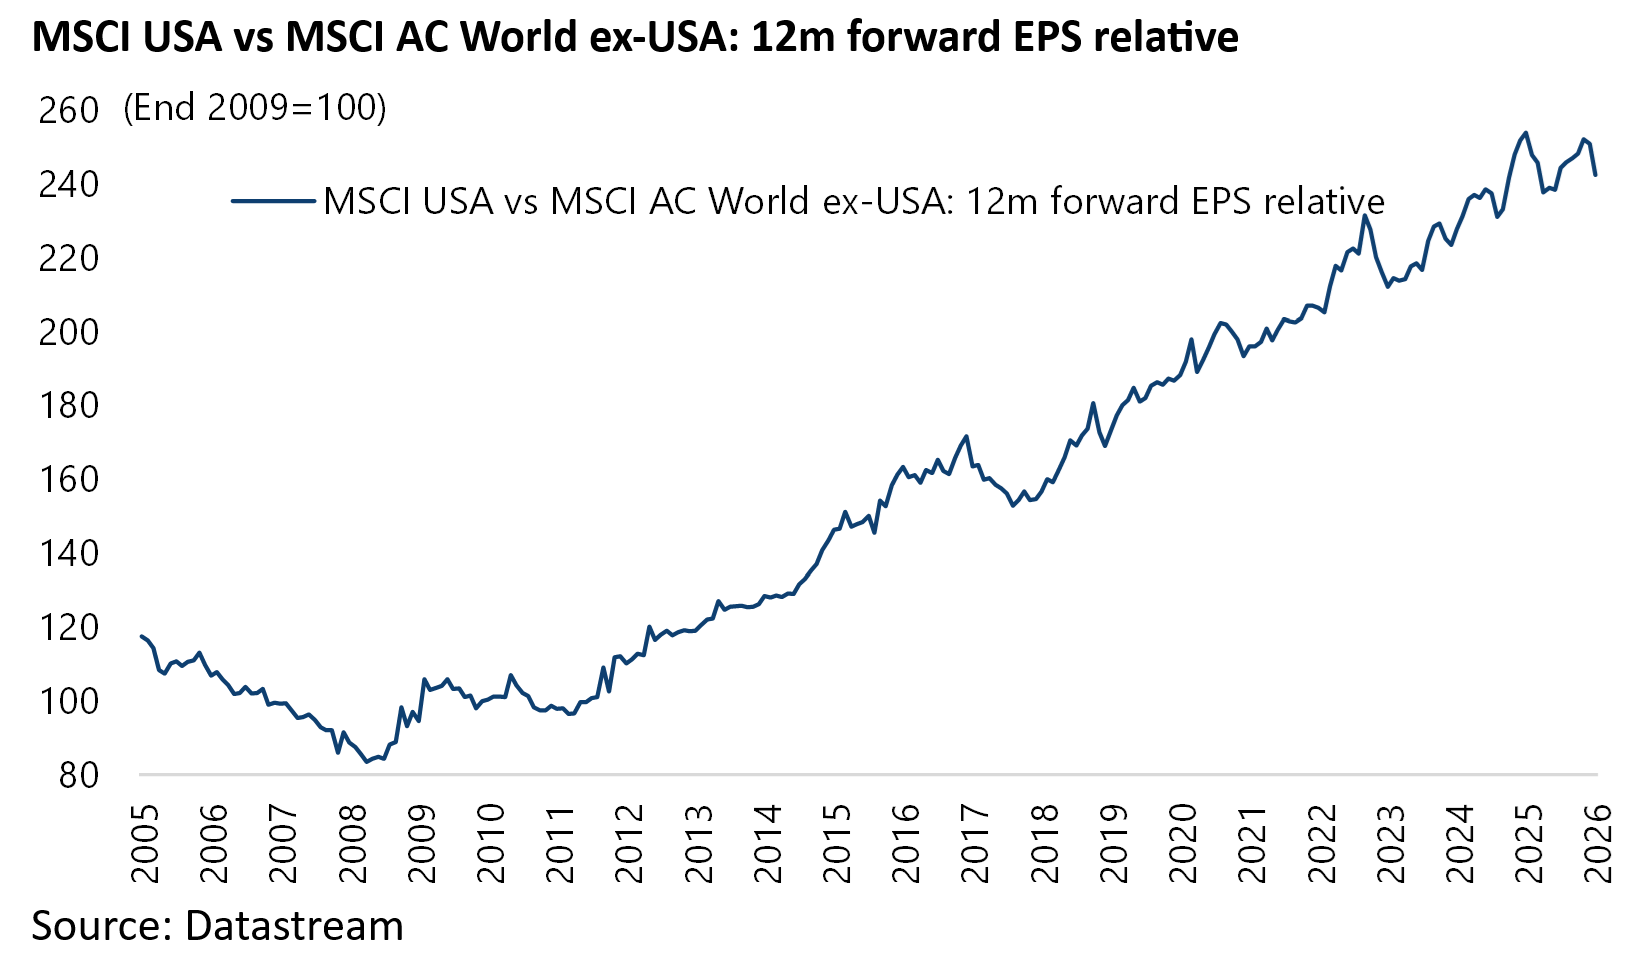
Still, while it is the case that the US underperformed MSCI AC World ex-US last year, rising by 16.3% compared with a 29.2% gain in the MSCI AC World ex-US, it is only fair to point out that the US has continued to report better earnings growth than other markets.
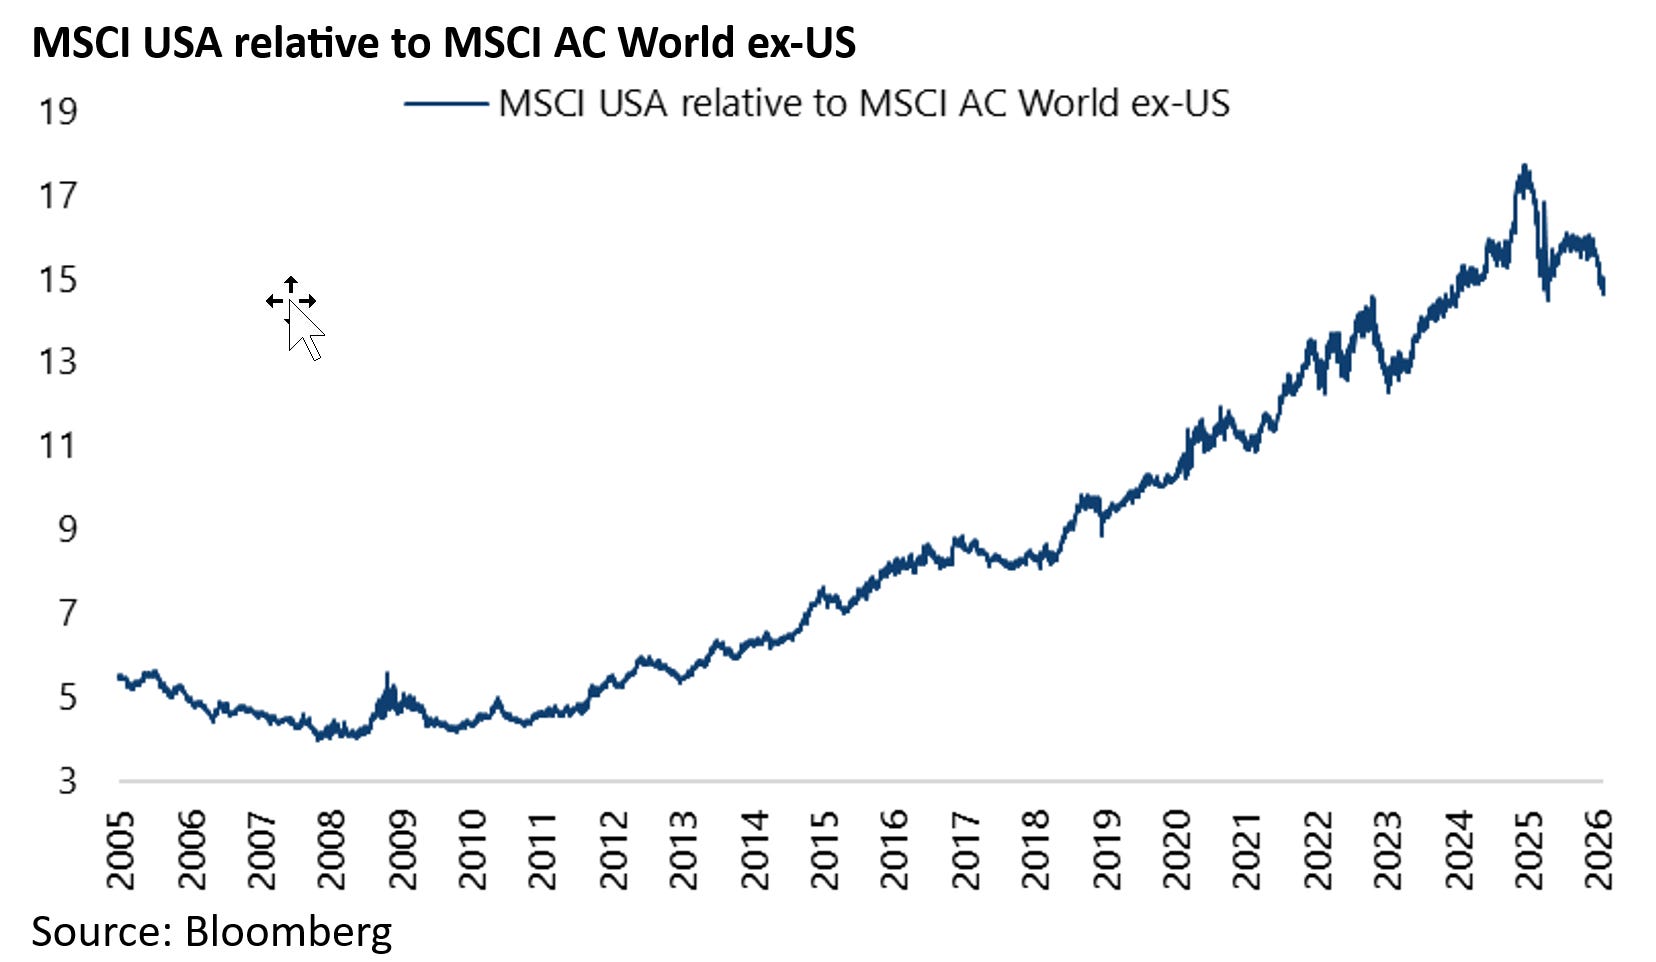
Thus, the 2025 and 2026 consensus earnings growth forecasts for MSCI USA are now 14.1% and 15.4% respectively, compared with 6.7% and 15.0% for MSCI AC World ex-US.
On a longer term basis, MSCI USA 12-month forward EPS has outperformed MSCI AC World ex-US 12-month forward EPS by 146% since the start of 2011.
This is another way of saying that the outperformance of Europe, Japan and emerging markets last year was driven by multiple expansion.
The MSCI Europe, Japan and Emerging Markets 12-month forward PE ratios have increased by 16%, 18% and 13% respectively since the beginning of 2025 to 15.6x, 17.3x and 13.5x, up from 13.4x, 14.7x and 12x at the end of 2024.
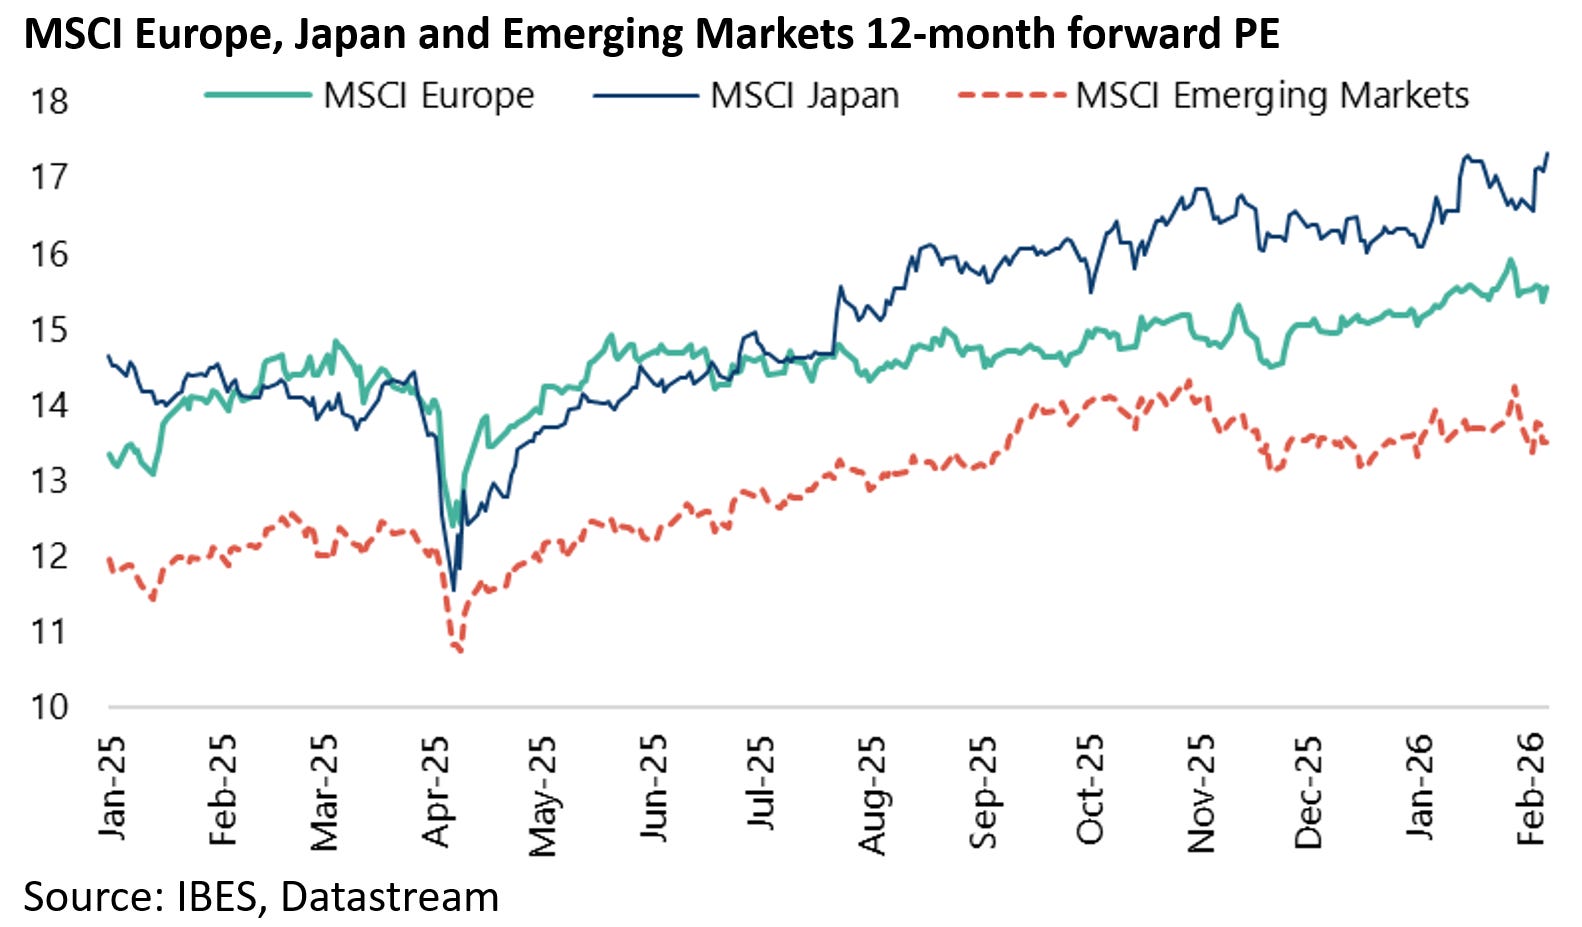
By contrast, MSCI USA 12-month forward PE is up “only” 2% from 21.9x to 22.3x over the same period.
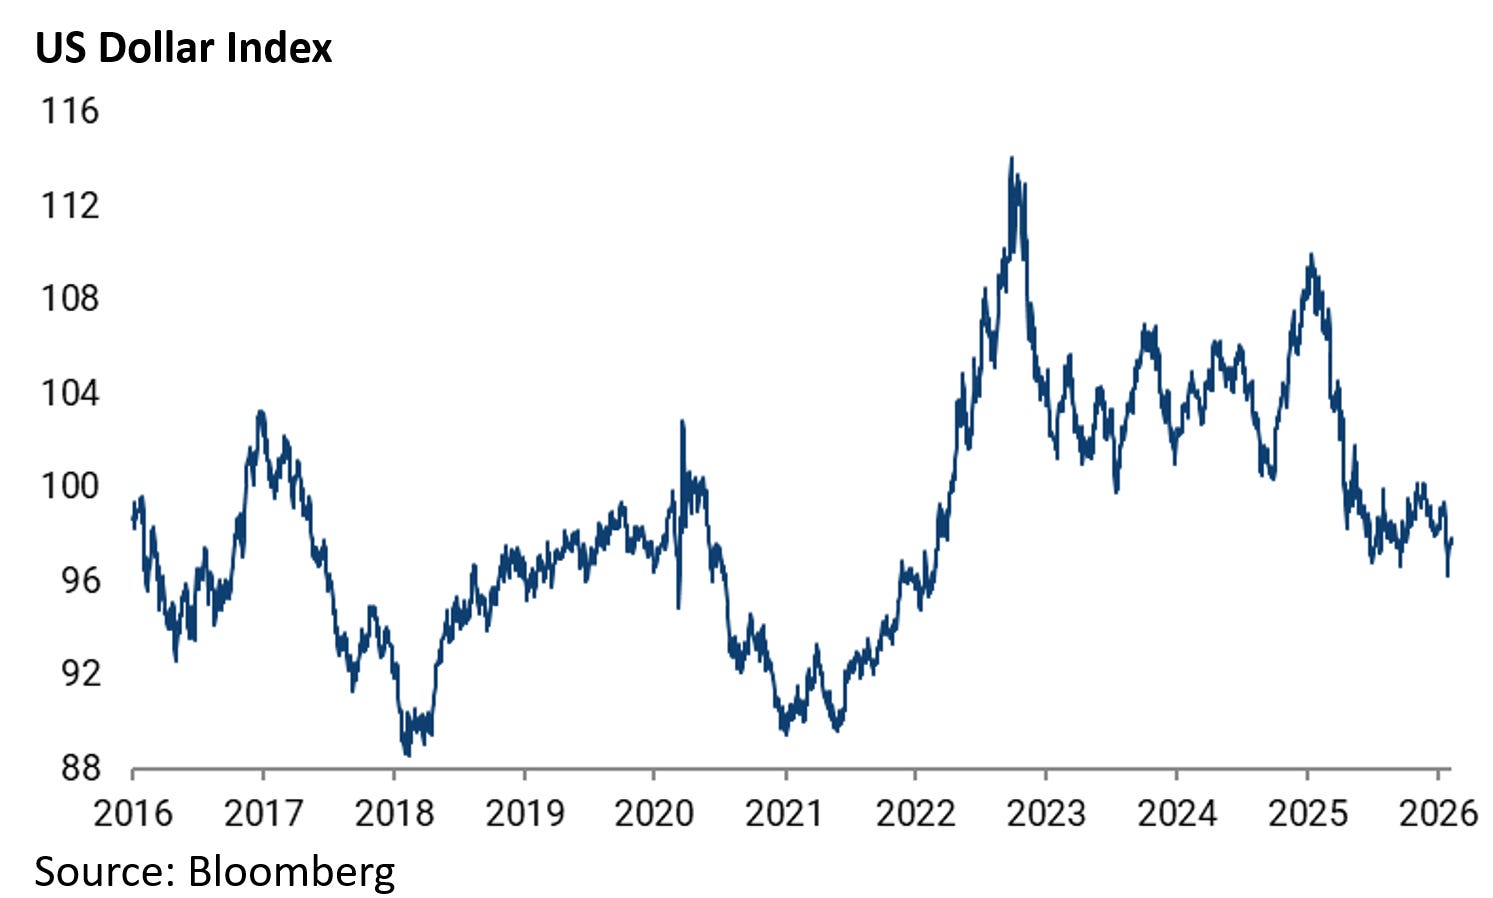
Also, as a result of this multiple expansion in the stock markets outside the US as well as the 10% decline in the US dollar index since the start of last year, it remains the case that America’s share of MSCI AC World Index peaked on 24 December 2024.
Still, for this view to be correct on a long-term basis, the earnings growth in other markets will have to pick up relative to the US.
Consensus 2026 earnings growth forecasts for MSCI Japan, Europe and Emerging Markets are now 9.4%, 11.7% and 23.2%, respectively, up from 0.9%, 8.1% and 14.1% for 2025.
Meanwhile, US earnings are very dependent on the continuation of the AI capex arms race.
The base case of this writer has been that this year will see investors starting to question the returns, or rather the lack of them, from the now three-year old AI capex arms race.
That process has now started to happen even if there is as yet no sign of the capex slowing.
Thus, the share prices of Microsoft, Amazon and Meta have already declined by 28%, 19% and 17% from last year’s peak, while Alphabet is down 7% from its peak on 3 February.
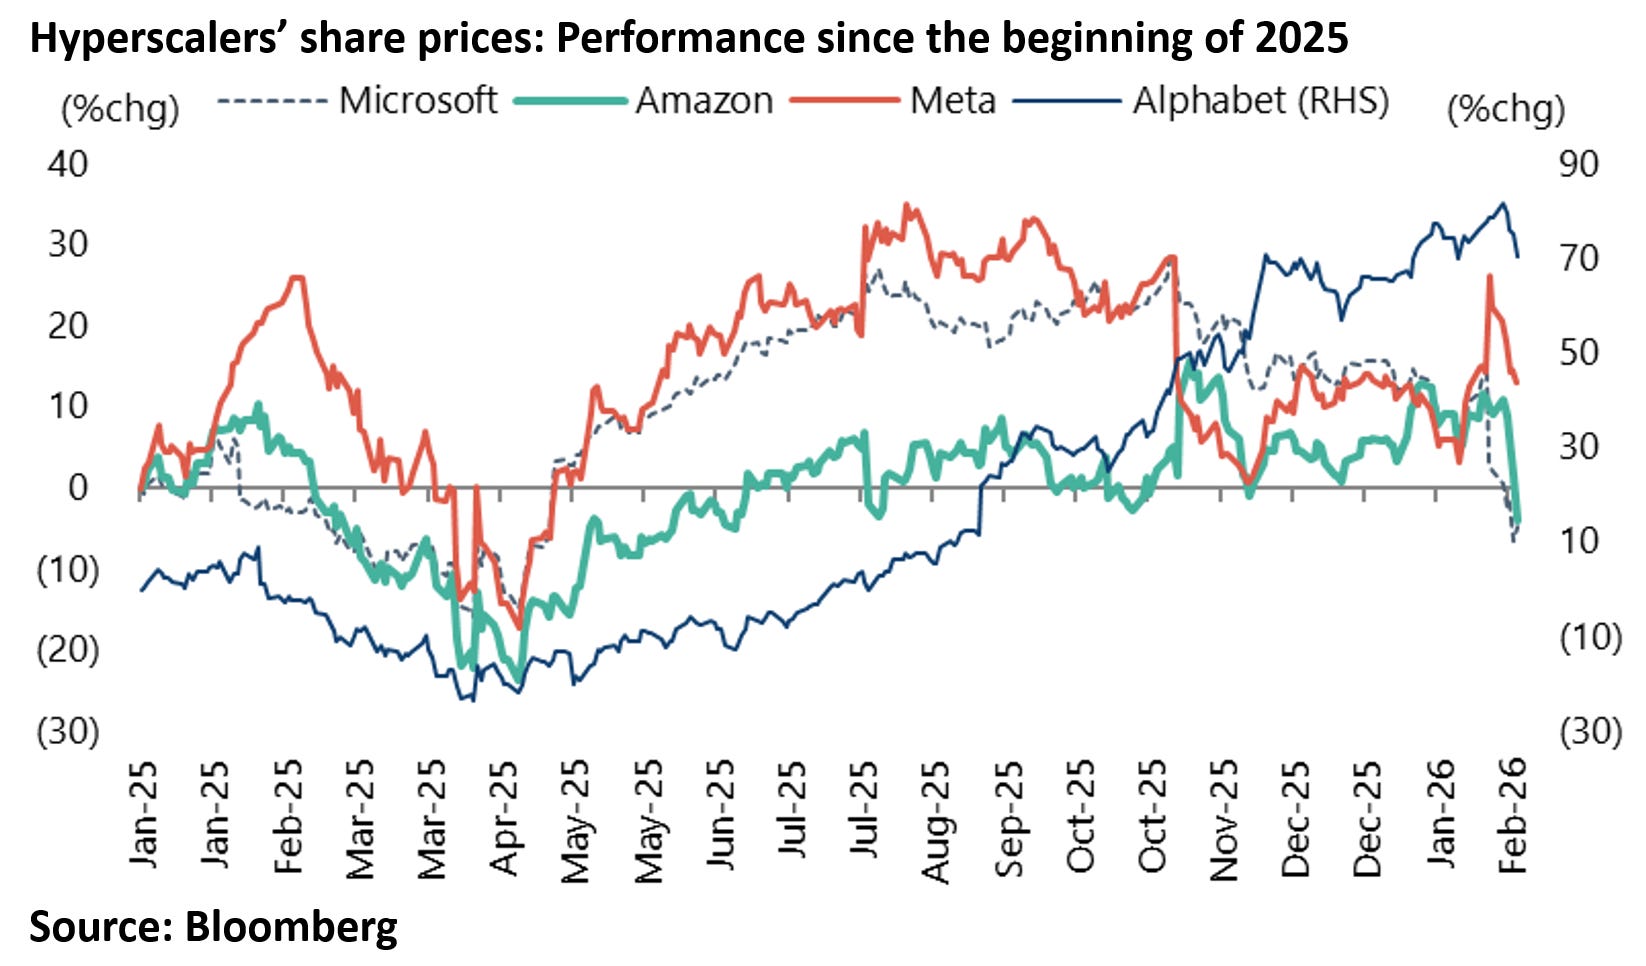
Yet, the hyperscalers in the most recent earnings seasons have continued to increase their capex.
Thus, Alphabet has doubled its capex guidance for 2026 to US$175-185bn, up from US$91bn in 2025, while Meta expects capex to total US$115-135bn in 2026, up from US$72bn in 2025.
Amazon also plans to invest US$200bn in capex this year, up from US$131bn in 2025.
AI Compute is Ramping, But is Demand There to Meet it?
This writer’s base case remains that the AI capex arms race will culminate in massive over-investment in data centers and the like as the Big Tech players feel compelled to participate for fear of being disrupted.
Still, if the focus up till now has primarily been on supply, in terms of the surging amounts being spent on AI capex, there is also the issue of demand.
And it is belief in the S-curve nature of demand for AI, particularly consumer demand, which has driven a lot of the investment in AI and indeed the growing tie-ups in recent months with OpenAI, be it Nvidia, Broadcom or Oracle.
This is, of course, to assume that OpenAI keeps growing, in terms of users, and, perhaps more importantly, starts monetising them.
On this point, the hope had been that OpenAI would become as dominant in consumer-orientated chatbots as Google has been in search.
But this is now increasingly questioned with the success Google has had incorporating its Gemini AI function into search.
The widely trumpeted S-curve dynamic, which was driving the frenzy to do deals with OpenAI, is easily illustrated.
OpenAI’s ChatGPT had 350m weekly active users two years after its public launch at the end of November 2022.
In OpenAI’s annual DevDay conference on 6 October, CEO Sam Altman said the number had risen to over 800m users.
In this respect, it remains the largest large language model in terms of users, though only about 5% of these users are paying the monthly fee of at least US$20. The monetization case is, therefore, far from proven.
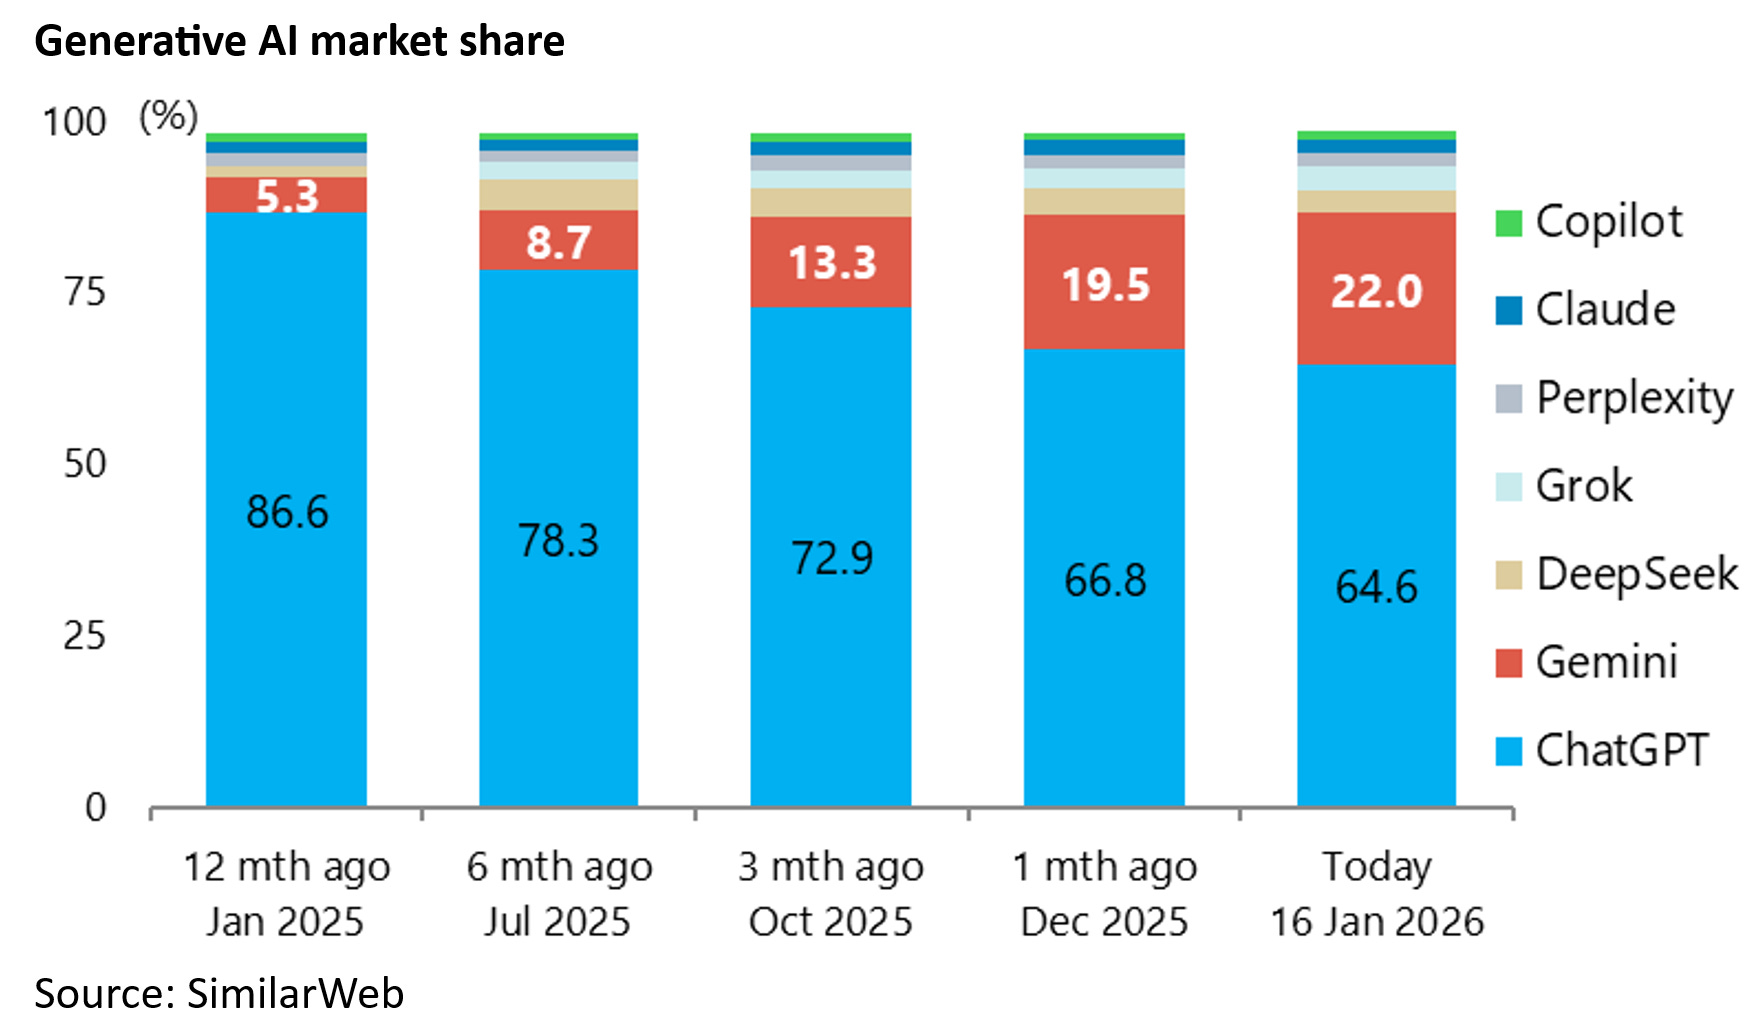
Still, the latest data shows Gemini taking market share from Open AI’s ChatGPT. Gemini’s web traffic share in the Generative AI market has increased from 5.3% to 22% over the past 12 months as of 16 January, while ChatGPT’s market share has declined from 86.6% to 64.6% over the same period, according to SimilarWeb.
Meanwhile, in the corporate market, Open AI has been losing out to Anthropic.
Thus, Anthropic’s Claude is primarily used for professional purposes with coding accounting for 34% of prompts, according to a recent study published by Anthropic (see Anthropic report: “Anthropic Economic Index report: Economic primitives”, 15 January 2026).
This compared with only 4.2% for ChatGPT, according to an OpenAI study published in September as a National Bureau of Economic Research (NBER) working paper (see NBER Working Paper No. 34255: “How People Use ChatGPT”, 15 September 2025).
Meanwhile, Anthropic’s AI coding tool Claude Code was only publicly launched in May last year and reached US$1bn in annualised recurring revenue in November.
The different usage is reflected in a starkly different revenue split.
At OpenAI, about 75% of revenues come from consumers paying the US$20 a month ChatGPT Plus plan, which is designed for casual users with more access and a faster response time than the free version, while companies make up the rest paying a higher monthly fee for full access to ChatGPT.
By contrast, 80% of Anthropic’s revenues come from enterprises.
To return to Goggle’s Gemini, as already noted, it is steadily gaining market share.
In this respect, Google has one big advantage.
It is already integrated into the lives of 90% of global internet users and AI functions, via Gemini, are now being integrated into the tools people use daily, be it as basic a function as drafting emails in Gmail.
It also means, if privacy is any concern at all, that people do not need to give up the data to another provider.
On this point, Google said in October that it processed more than 1.3 quadrillion tokens every month with its AI models, up from 9.7 trillion in April 2024.
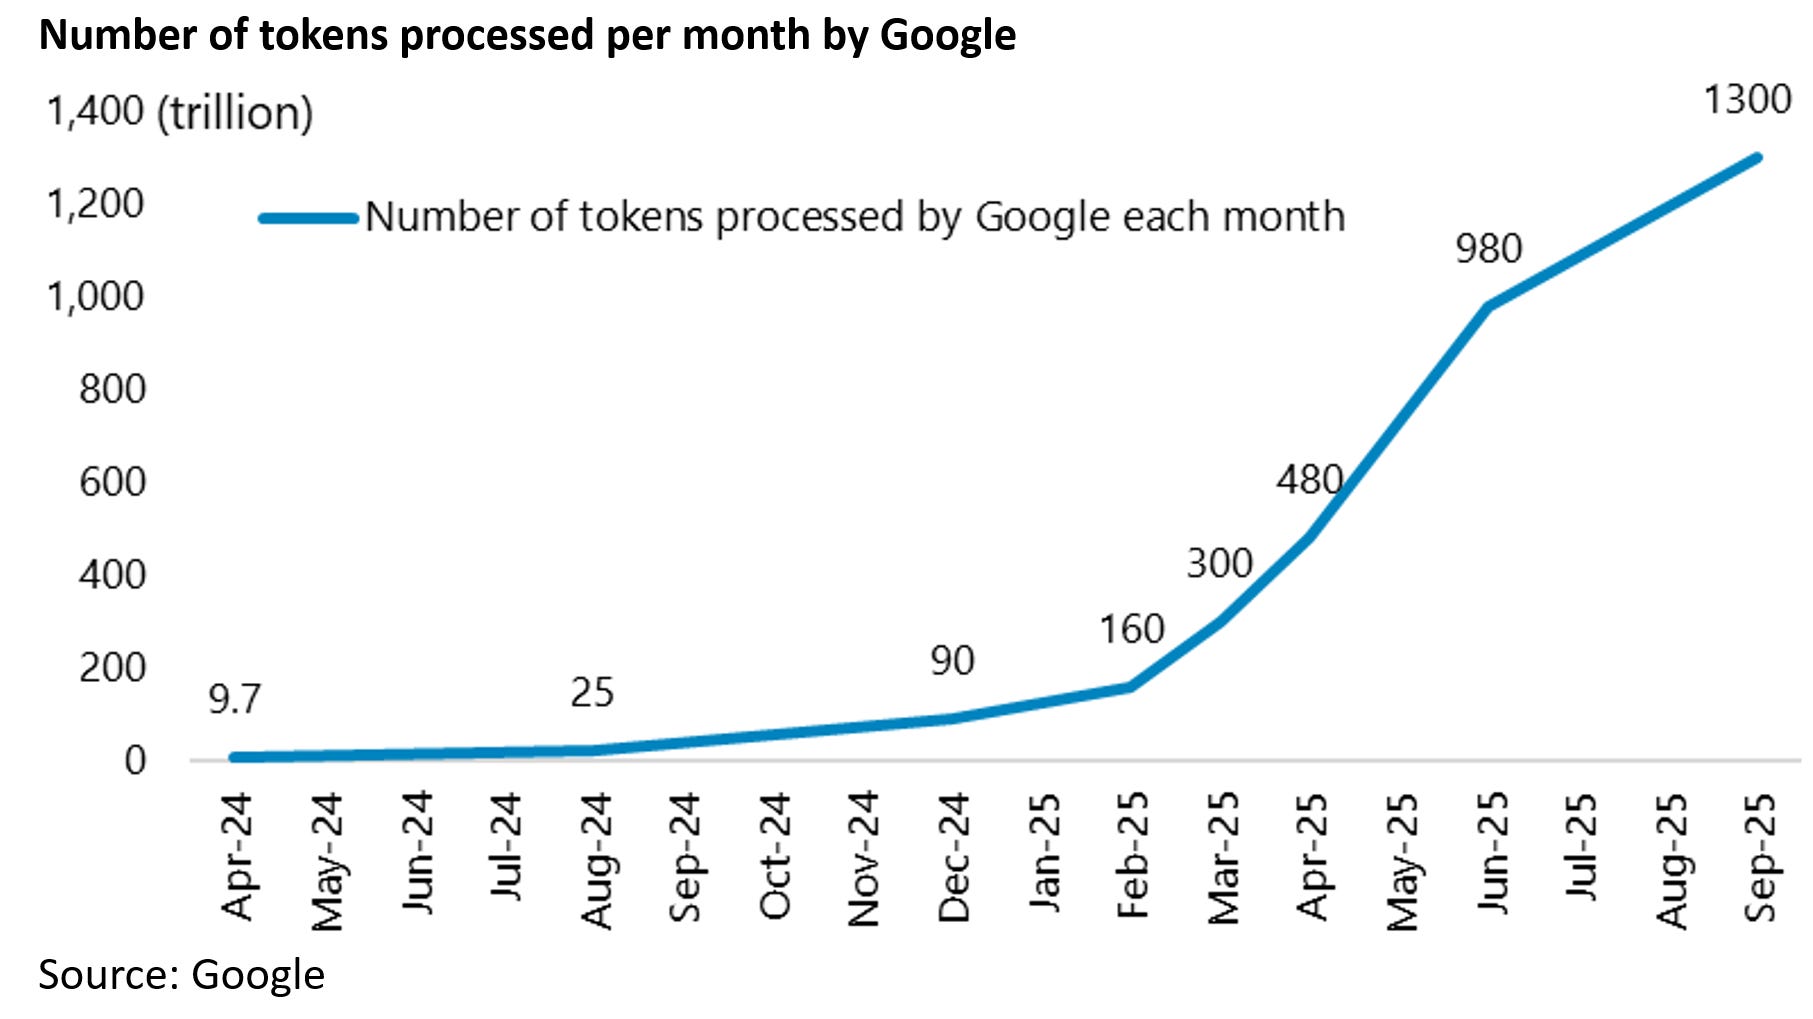
There has been no update since so far as this writer is aware.
By contrast, OpenAI is processing around 260 trillion tokens per month from ChatGPT and Application Programming Interface (API) usage.
So, Google is roughly five times OpenAI’s monthly token volume as a result of embedding AI across many high-traffic surfaces. Meanwhile, the Alphabet valuation is far from insane if search is not disrupted.
Alphabet is now trading at 27x 2026 consensus forecast earnings and 9.7x sales. Compare this with Nvidia which is currently trading at 24x sales, or OpenAI which is now talking about an IPO valuing the company at up to US$1tn even though it is only generating annualised revenues of US$20bn.
All of the above is to highlight that it is far from clear who is going to be the winner in terms of the race to build large language models.
While, so far as this writer can tell, no killer app has yet been developed for the masses in terms of the practical application of AI.
But the upside of the seemingly inevitable over-investment bust when it happens, in terms of the amount being spent on chips and AI data centers, is that the costs of so-called “inference” should collapse and demand should surge.
This is, of course, what happened in the Dotcom bust when fiber optic capacity caused a big decline in the cost of broadband and the resulting explosion in e-commerce demand.
The difference this time, of course, is that the AI chips have a much shorter shelf life (apparently 3-4 years) than fiber optic cables (around 25 years).