A Pronounced Slowdown in Inflation is Coming
Author: Chris Wood
The base case here remains that a downturn in the US economy is coming, along with a pronounced slowdown in inflation, with the key question remaining the lags in monetary policy.
The core reason for this view is the ongoing collapse in M2 growth.
US M2 declined by a record 4.5% YoY in April and was down 3.7% YoY in July.
Similarly, the contrasting surge in M2 growth in 2020 was the reason this writer abandoned a disinflationary view of the Western economies held for more than 30 years.
True, this return of inflation does not need to be a permanent affair.
And if the Federal Reserve keeps tightening until core PCE inflation is below 2% on a YoY basis again, be it either by further rate hikes or more balance sheet reduction or a combination of both, then inflation will likely really collapse, and a lot of money can be made by owning the long end of the Treasury bond market.
Still, the base case remains for another abrupt change in Fed policy once it becomes clear that the employment market is weakening, most particularly if that is accompanied by the sudden emergence of credit concerns.
On that point, the Fed’s response to Silicon Valley Bank was a recent reminder, if it was needed, of the system’s lack of tolerance for pain.
Meanwhile, another reason for the lagged impact of monetary tightening in America in this cycle is the sheer overhang of excess money in the system as a result of the dramatic surge in broad money growth triggered by Covid.
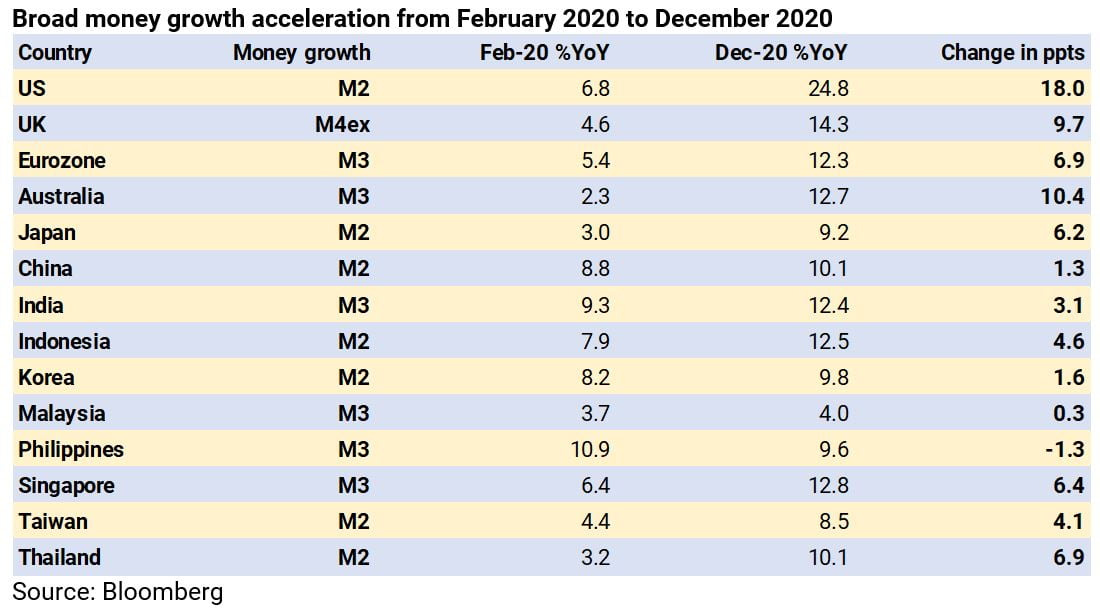
Remember that M2 was growing at 24.8% YoY at the end of 2020 compared with only a 6.8% YoY increase in February 2020 as a result of the extreme monetary policy response to Covid.
This represented an 18-percentage-point (ppt) increase, the likes of which has not been seen since the M2 data series began in 1959.
US M2 growth subsequently peaked at 26.9% YoY in February 2021.
This raises the issue of when that overhang of excess money, or liquidity, is finally out of the system and the impact of monetary tightening really starts to kick in.
This dynamic is best captured in a chart of the ratio of broad money (M2) to nominal GDP, which is the inverse of velocity.
The chart shows that the ratio (0.777) was still 4.4% above the pre-Covid trend in 2Q23, though well down from the peak (0.899) reached in 2Q20 when it was 27% above trend.
This means liquidity is likely to decline below trend in coming quarters, which has negative implications for asset markets and the economy.
Money Supply, Not Supply Chains Drove Recent Inflation
Meanwhile, the relative expansion of broad money supply growth in 2020, or the lack of such an expansion, remains the best way to demonstrate why the G7 world has suffered a surge in inflation in recent years whereas Asia has not.
Thus, the next biggest increases in broad money growth in 2020 after America were in Australia and Britain, both of which also saw resulting surges in inflation.
The broad money growth in Australia and the UK increased by 10.4ppts and 9.7ppts, respectively, in the period between February and December 2020 to 12.7% YoY and 14.3% YoY.
By contrast, the situation was very different in most Asian countries.
This is because these Asian governments did not pay people to do nothing during the pandemic and so central banks were not under the same pressure to finance indirectly such transfer payments.
In China and India, the two most important countries, the increases in broad money growth between February and December 2020 were only 1.3ppts and 3.1ppts, respectively.
Gov't Deficits Balooning as the Fed Tries to Fight Inflation
Meanwhile, if monetary tightening continues, fiscal easing continues.
The US annualised fiscal deficit has already risen from US$958bn or 3.9% of GDP in July 2022 to US$2.26tn or 8.6% of GDP in July 2023.
This is increasing market focus on the rising cost of financing America’s huge fiscal deficits.
In this respect, it should be remembered that the debt ceiling deal agreed in early June did not raise the debt ceiling to a certain level but rather simply suspended it, conveniently for both major political parties, until 1 January 2025 or after the November 2024 presidential election.
This fiscal fudge is not so comforting from the standpoint of a foreign creditor to the US, most particularly if it ever becomes a permanent fudge, and certainly stranger things have happened.
That, in turn, will renew concerns on the status of the US dollar.
If the US dollar remains for now the global reserve currency, its status is certainly not as assured as it once was given the growing efforts of China and others in the developing world to trade increasingly in their own currencies, a strategy which has been years in the making but which received further impetus from the freezing of Russia’s foreign exchange reserves last year in response to the invasion of Ukraine.
The result of the above is that the US dollar’s share of global foreign exchange reserves has fallen from 73% to 59% over the past 22 years.
Central Banks Continue Selling US Treasuries
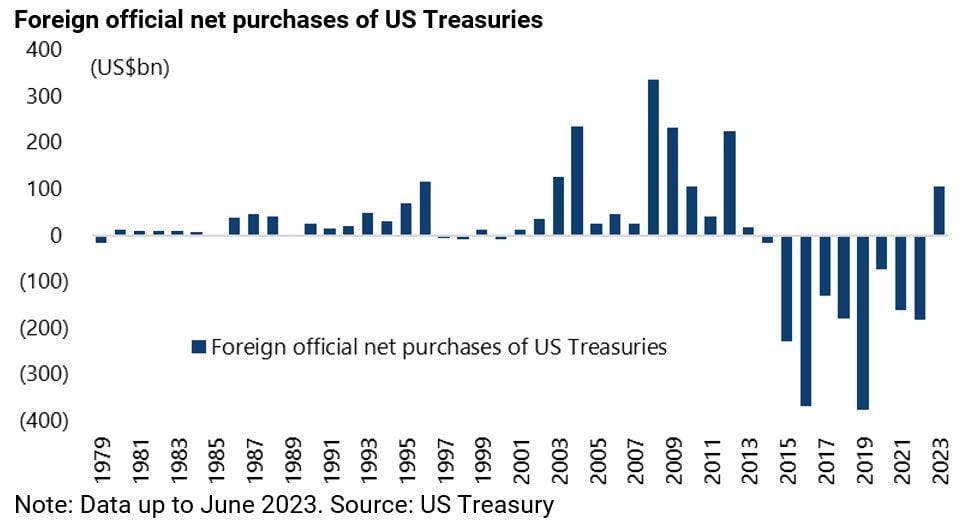
Meanwhile, another way of looking at the same trend is the ongoing decline in central bank purchases of Treasury bonds.
Indeed, foreign central banks became significant net sellers of Treasury securities in 2014 for the first time since the 1970s.
They have sold a net US$18bn of Treasuries in 2014 and a net US$1.62tn since then, though they have bought a net US$105bn in the first six months of this year.
While the two largest holders of Treasuries, China and Japan, have continued to be net sellers.
Japan’s holdings of Treasury securities have declined by 17% from US$1.326tn in November 2021 to US$1.106tn in June, while China’s holdings of Treasury securities have declined by 24% from US$1.104tn in February 2021 to US$835bn in June.
The political reasons for China to keep reducing exposure to US government debt would seem self-evident.
But Japan is also potentially significant because of the capital repatriation risk triggered by a potential further adjustment of yield curve control at forthcoming Bank of Japan meetings.
In this respect, the more the consensus abandons the view that a recession is coming in America, the more likely the BoJ is to tighten policy further, be it by ending negative rates or by allowing a wider trading band for the ten-year JGB yield, or indeed a combination of both.
The Japanese central bank already effectively moved the upper bound of the yield curve control band from 0.5% to 1.0% at its policy meeting in late July.
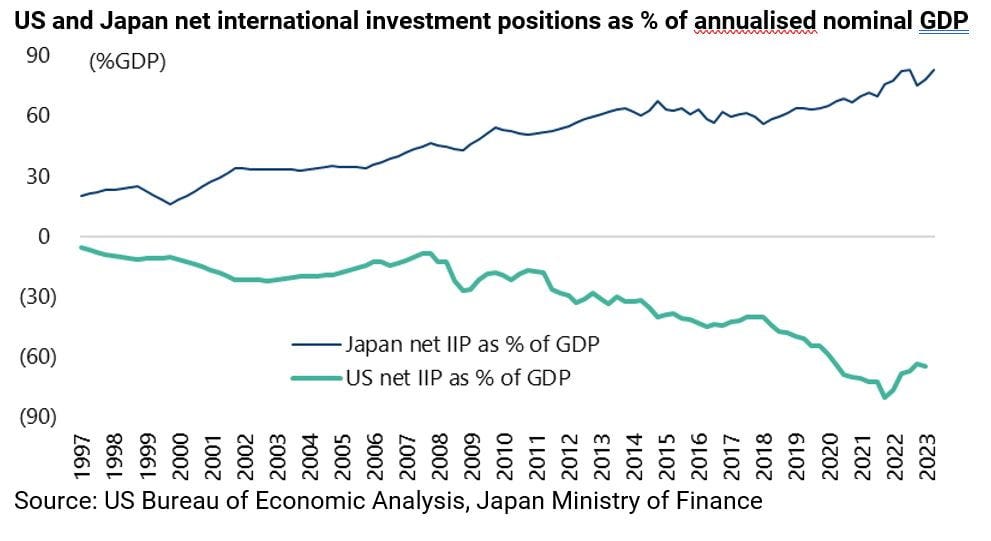
It is also worth highlighting that Japan’s net international investment position is in many respects the mirror image, or the exact opposite, of America’s.
This measures the gap between a nation’s stock of foreign assets and foreigners’ stock of that same nation’s assets, including direct investment, portfolio investment, other investment, and reserve assets.
Japan’s net international investment position as a percentage of GDP rose to a record 83.2% in 2Q23.
By contrast, America’s net international investment position as a percentage of GDP fell to a record negative 80.6% in 4Q21 and was a negative 64.6% in 1Q23.
The improvement from negative 80.6% to negative 64.6% since 4Q21 has been caused mainly by declines in the net direct investment and portfolio investment positions.
Thus, foreign holdings of US direct investment and portfolio investment assets have declined by US$1.85tn and US$3.12tn, respectively, since 4Q21, while US holdings of foreign direct and portfolio investment assets are down US$932bn and US$1.66tn over the same period.


Hi Chris.
Re UST holdings: I would argue the value of their UST holdings has fallen (price drop) because the interest rates have risen, no? How do you know they sold? It looks just like with the US banks, svb, first republic, etc.